_05_22_2026_02_22_33_828047.jpg)
Key Highlights
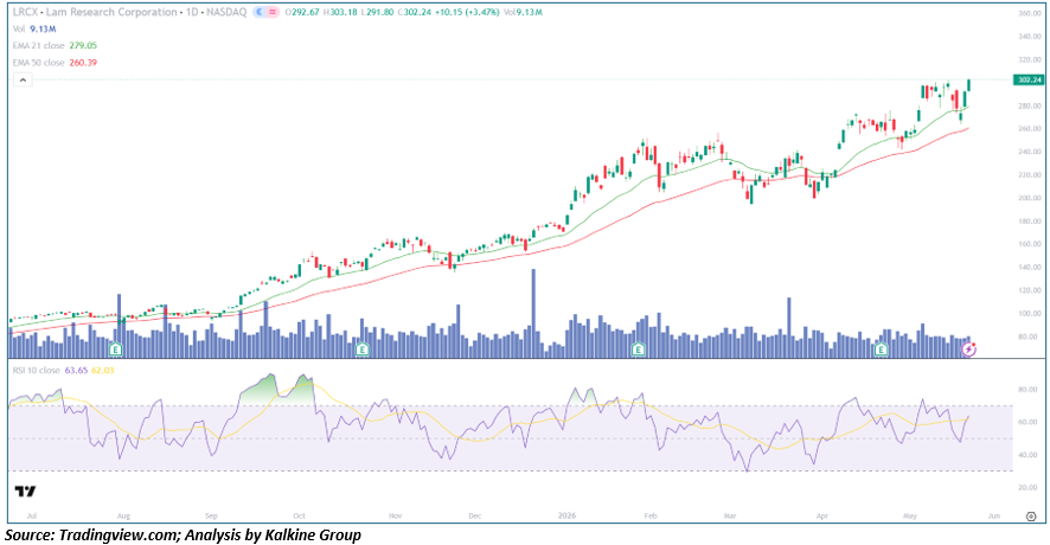
- LRCX closed at $302.24, gaining +3.47% in a strong breakout session
• Price traded between $292.67 and $303.18 intraday, reflecting aggressive upside momentum
• The stock is trading well above the EMA-21 ($279.05) and EMA-50 ($260.39), confirming strong bullish trend alignment
• RSI-10 climbed to 63.65, signaling healthy momentum without extreme overbought conditions
• Volume reached 9.13M shares, above average levels and supportive of institutional participation
• The stock has maintained a consistent pattern of higher highs and higher lows since mid-2025
• Current price action suggests breakout continuation rather than exhaustion or speculative blow-off behavior
Trend Structure: From Consolidation Reset to ATH Breakout Expansion
Phase 1 — Sustained Uptrend Development (Jul 2025 – Feb 2026)
LRCX established one of the cleanest bullish structures within the semiconductor sector during the second half of 2025.
During this phase:
- Price consistently printed higher highs and higher lows
• EMA-21 remained above EMA-50 throughout most of the advance
• Pullbacks repeatedly found support near short-term moving averages
• Institutional accumulation appeared persistent during breakout continuation phases
Momentum remained constructive as semiconductor and AI infrastructure Demand accelerated broadly across the sector.
Phase 2 — Consolidation & Momentum Reset (Feb – Apr 2026)
After an extended rally, LRCX entered a healthy consolidation phase.
Key developments included:
- Sideways price action developed beneath resistance
• RSI cooled from elevated conditions without major technical damage
• EMA-21 continued rising beneath price despite consolidation
• Selling pressure remained controlled and orderly
Rather than triggering a deeper correction, the consolidation acted as a momentum reset within the broader uptrend.
Phase 3 — Breakout Acceleration & Fresh ATH Expansion (May 2026)
The current phase reflects a decisive bullish breakout.
LRCX has now:
- Cleared prior resistance zones decisively
• Printed a fresh all-time High Close above $300
• Maintained strong bullish candle structure into the close
• Confirmed breakout strength on elevated volume participation
Importantly, the breakout candle showed minimal upper-wick rejection, suggesting buyers remained firmly in control throughout the session.
Moving Averages: Textbook Bullish Alignment Remains Intact
The moving-average structure continues reflecting strong trend quality.
EMA-21 ($279.05)
- Rising steadily upward
• Acting as primary dynamic support
• Successfully defended multiple pullbacks during the broader uptrend
EMA-50 ($260.39)
- Trending strongly higher
• Reinforces medium-term trend stability
• Remains comfortably below current price, confirming momentum acceleration
The current alignment — Price > EMA-21 > EMA-50 — represents a classic continuation structure commonly seen in strong semiconductor momentum leaders.
Momentum Analysis: RSI Signals Healthy Trend Strength
RSI-10 currently sits at 63.65, reflecting strong bullish momentum without entering excessively overbought territory.
Current RSI behavior suggests:
- Momentum remains constructive rather than exhausted
• Buyers continue controlling trend direction
• The breakout still has room for continuation before overheating risks rise materially
The RSI signal line crossover also confirms improving momentum participation following the prior consolidation phase.
Volume Analysis: Institutional Participation Supports the Breakout
Volume behavior strongly validates the technical breakout.
Key observations include:
- Breakout volume exceeded recent average participation
• Strong buying activity accompanied the ATH breakout
• No evidence of panic Reversal selling emerged near highs
This type of price-volume structure is commonly associated with:
- Institutional accumulation
• High-conviction momentum buying
• Sector-wide semiconductor Leadership participation
At present, the breakout appears structurally supported rather than speculative alone.
Key Technical Levels
Resistance Levels
- $303.18 — immediate breakout high
• $310–$315 — near-term momentum expansion zone
• $325 — projected breakout extension target
Support Levels
- $291–$293 — immediate breakout support zone
• EMA-21 at $279 — primary dynamic support
• EMA-50 at $260 — major medium-term trend support
• Below $255 — broader trend structure weakens materially
Scenario Analysis
- Bullish Continuation (Primary Case)
If LRCX sustains above the $291–$293 breakout zone:
→ Momentum could extend toward $310–$325
→ RSI may continue strengthening toward bullish expansion territory
→ Semiconductor AI infrastructure momentum could continue attracting institutional inflows
- Consolidation Phase (Healthy Outcome)
Following the breakout, the stock may temporarily consolidate:
→ Sideways range between $290–$305
→ RSI cools gradually
→ EMA-21 catches up beneath price
This would reinforce the broader bullish trend structure.
- Bearish Failure (Risk Case)
A failed breakout below the EMA-21 with heavy selling pressure could trigger profit-taking:
→ First downside target near EMA-50 at $260
→ Breakdown below $255 would weaken the broader bullish structure materially
→ Momentum participation could slow temporarily
Currently, this remains a secondary scenario.
Fundamental Backdrop: AI Infrastructure Demand Continues Supporting Growth
The bullish technical breakout is supported by strong operational momentum.
Lam Research recently delivered strong Q3 FY2026 results, including:
- Record Revenue and EPS performance
• Strong growth across memory and customer support segments
• Improving operating margins
• Positive forward guidance tied to AI infrastructure demand
Fiscal 2025 revenue reached approximately $18.44B, representing strong year-over-year growth as semiconductor Capital spending continues accelerating.
Wall Street sentiment also remains constructive, with analysts maintaining a broadly bullish outlook on long-term AI-related semiconductor demand trends.
Conclusion: LRCX Strengthens Its Position as a Semiconductor Momentum Leader
Lam Research continues behaving like a premier semiconductor momentum leader as institutional demand returns aggressively following its recent consolidation phase.
The technical structure now reflects:
- Strong bullish moving-average alignment
• Fresh all-time high breakout momentum
• Institutional-quality volume confirmation
• Healthy RSI trend strength
• Sustained higher-high and higher-low behavior
The framework moving forward is increasingly clear:
- Above $291–$293 → bullish momentum remains dominant
• Above $303 → breakout acceleration likely strengthens further
• Below EMA-21 → near-term caution increases materially
For momentum traders and semiconductor-focused investors, LRCX continues demonstrating the characteristics of a high-quality AI infrastructure trend leader, with current price action suggesting the broader uptrend remains firmly intact.
_06_11_2026_12_45_08_746277.jpg)


 Please wait processing your request...