
Key Highlights
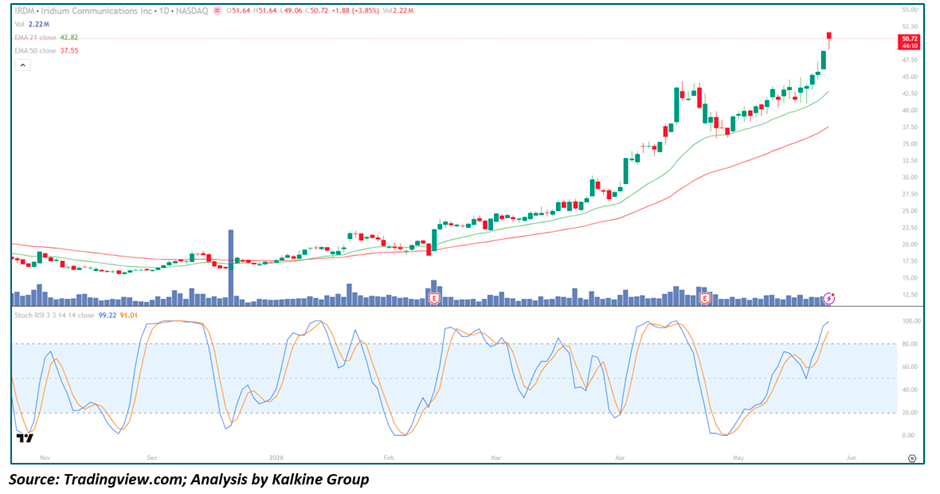
- IRDM closed at $50.63, gaining +$1.78 (+3.65%) in a steady continuation session that extended the stock's parabolic advance
- Price traded between $49.06 and $51.64 intraday, closing near the upper end of the range — a sign of sustained buying pressure into the close
- The stock is trading significantly above both the EMA-21 ($42.81) and EMA-50 ($37.55), confirming a powerfully bullish trend structure
- Stochastic RSI at 99.22 with the signal line at 91.01 — deep in overbought territory, but both lines rising steeply, confirming momentum acceleration rather than exhaustion
- Volume at 2.22M was consistent and supportive, reflecting ongoing institutional participation behind the advance
- IRDM has more than doubled from the November lows near $19, delivering an extraordinary multi-month advance as the satellite communications thematic accelerates
- Current price action reflects a trend running at full velocity — the structure shows no technical evidence that the advance is over
Trend Structure: From Prolonged Dormancy to Parabolic Leadership
Phase 1 — Extended Base & Quiet Accumulation (Nov 2025 – Jan 2026)
IRDM spent the final months of 2025 and the opening weeks of 2026 in a tight, low-energy consolidation near the $18–$22 region:
- Both EMAs flat and closely wound, reflecting a market in equilibrium with no directional bias
- Volume minimal and directionless throughout the period, with one notable anomalous spike in December that produced no follow-through
- Price action compressed into a narrow range — the hallmark of a stock under quiet accumulation before a major directional move
- Repeated tests of the EMA-50 from above established a firm structural floor beneath price
- No meaningful trend in either direction, masking what would become a powerful institutional accumulation phase
The extended dormancy of this period created the slingshot energy that powered the subsequent breakout.
Phase 2 — Initial Breakout & First Momentum Surge (Feb – Mar 2026)
A catalyst-driven volume event in late January ignited IRDM's first major advance:
- Price surged from the $22 base toward the $34–$36 region in a rapid sequence of sessions
- An Earnings-related volume spike in late January confirmed institutional urgency behind the move
- Both EMAs began rising sharply as price pulled decisively clear above them
- RSI conditions became elevated rapidly, reflecting genuine momentum ignition
- A brief consolidation followed at the $22–$24 level, with the stock finding support before resuming its advance
This first surge established IRDM as a legitimate momentum leader within the satellite communications theme.
Phase 3 — Acceleration & Parabolic Expansion (Mar – May 2026)
The current phase represents a dramatic step-change in both pace and magnitude:
- Price broke out of the February consolidation range with force, surging from $24 toward $44 through March and April
- A second earnings event in April provided another institutional-grade volume catalyst, launching price toward the $44–$46 zone
- A brief pullback and consolidation near $38–$40 followed — healthy digestion that reset the Stochastic RSI before the next leg higher
- The most recent advance has pushed IRDM above $50 for the first time — a major psychological milestone
- The EMA-21 ($42.81) and EMA-50 ($37.55) are rising steeply in a powerfully bullish stack, well below current price
Moving Averages: Bullish Trend Structure at Maximum Strength
EMA-21 ($42.81)
- Rising at its steepest angle throughout the entire chart history — a slope that reflects the extraordinary velocity of the current advance
- Sits approximately 15% below current price, confirming the momentum expansion is genuine and persistent
- Has consistently acted as the key support level during every pullback in the current phase
- A return to this level would represent a meaningful but entirely buyable correction within the context of the broader trend
EMA-50 ($37.55)
- Turning higher decisively after months of gradual recovery from flat base conditions
- Sits approximately 26% below current price — confirming the extraordinary strength of the current move
- Represents the ultimate structural support line for the broader bull thesis
- The widening gap between the EMA-21 and EMA-50 signals a trend running at full velocity
The bullish EMA stack — price well above EMA-21, EMA-21 well above EMA-50, both rising steeply — is as clean and powerful a trend structure as exists in the current market.
Momentum Analysis: Stochastic RSI Deep in Overbought — But Trend Remains the Boss
Stochastic RSI at 99.22 with the signal line at 91.01 places momentum at the extreme upper end of its range. Both lines are rising sharply and converging near the ceiling, reflecting a momentum condition that is exceptional in its intensity.
Current Stochastic RSI behaviour suggests:
- Momentum is accelerating into extreme overbought rather than fading from it — a key distinction that separates trending regimes from topping patterns
- In strong momentum stocks, Stochastic RSI can sustain readings above 80 for extended periods without meaningful price deterioration
- The signal line at 91.01 sitting below the Stochastic RSI line confirms the bullish crossover is fresh and active
- Prior instances of the Stochastic RSI reaching the 80–100 zone in this chart were consistently followed by continued short-term gains before any meaningful pullback
- Near-term traders should watch for the Stochastic RSI rolling over from the 100 ceiling while price stalls — that divergence would be the first warning signal of near-term exhaustion
Volume Analysis: Consistent Institutional Participation Validates the Move
Volume behaviour throughout IRDM's advance has been a consistent source of conviction for bulls.
Key observations include:
- Two major institutional-scale earnings volume events bookend the advance — the January breakout spike and the April re-acceleration catalyst
- The current advance from April onward has been accompanied by consistently above-Average Daily Volume
- Today's 2.22M session volume is steady and confirms ongoing participation
- Down-days during the advance have consistently shown lighter volume than up-days — the defining characteristic of a healthy, institutionally supported uptrend
- No single heavy-volume Reversal day is visible — distribution, if present, is not yet detectable in the volume structure
Key Technical Levels
Resistance Levels
- $51–$52 — immediate session high zone and all-time high region
- $55 — first psychological extension target
- $58–$60 — measured move target based on the depth and duration of the base formation
- $65+ — longer-term momentum expansion target if satellite communications thematic continues to attract Capital
Support Levels
- $49–$50 — immediate intraday support and psychological round number
- EMA-21 at $42.81 — primary dynamic support and key pullback buy zone
- $38–$40 — prior consolidation zone and secondary structural support
- EMA-50 at $37.55 — major structural support and ultimate bull thesis defence line
- $34–$36 — prior breakout zone and tertiary structural support
Scenario Analysis
- Bullish Continuation (Primary Case)
If IRDM sustains above the $49–$50 support zone: → Momentum could extend toward the $55 psychological level and beyond → Stochastic RSI sustaining near extreme readings would confirm a true momentum expansion phase → Satellite communications and space infrastructure thematic could continue attracting speculative and institutional inflows → Measured move target from the base breakout points to the $58–$60 region on a multi-week horizon
- Consolidation Phase (Healthy Outcome)
Following the sharp advance, a period of sideways digestion is entirely normal and constructive: → Price ranges between $45–$52 while Stochastic RSI cycles from overbought back toward the mid-range → EMA-21 rises to meet price, tightening the base and reducing the extension → A tight flag or pennant formation from current levels would set up the next powerful breakout leg → No thesis damage while price holds above the EMA-21 at $42.81
- Bearish Reversal (Risk Case)
A sharp reversal below $42 on heavy volume would signal a failed breakout: → First downside target near EMA-50 at $37.55 → Momentum structure would weaken materially on a close below the EMA-21 → Given the parabolic nature of the advance, profit-taking risk is elevated — position sizing discipline is essential → This remains a secondary scenario while price holds above the EMA-21
Conclusion: IRDM Is One of the Most Compelling Momentum Charts in the Market Right Now
Iridium Communications has transformed from a quiet, range-bound small-cap into one of the market's most powerful momentum stories — and today's continued advance above $50 on steady volume confirms that the bulls remain in complete control of the narrative. The technical structure is as clean as it gets: a multi-month base, a powerful breakout, healthy consolidation phases, and now a parabolic expansion with both EMAs rising steeply in bullish alignment.
The framework moving forward is clear:
- Above $49–$50 → bullish momentum dominant, target $55 and beyond
- Above $55 → psychological breakout, momentum expansion toward $58–$60
- Below EMA-21 at $42.81 → near-term caution, monitor for distribution signals
- Below EMA-50 at $37.55 → broader thesis under review
For momentum traders, IRDM is precisely the kind of chart that demands attention — a high-conviction, high-velocity trend in a thematically compelling sector, currently running at full speed with no technical evidence that the advance is over.


 Please wait processing your request...