
Key Highlights
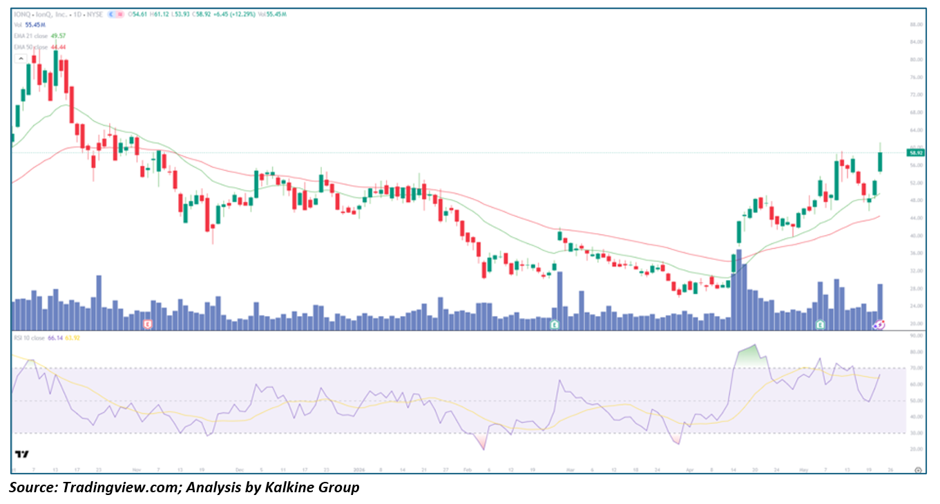
- IONQ closed at 58.92, gaining +12.29% in a strong breakout session
• Price traded between 53.93 and 61.12 intraday, reflecting aggressive buying activity
• The stock is trading firmly above the EMA-21 (49.57) and EMA-50 (44.44), confirming bullish trend alignment
• RSI-10 climbed to 66.14, signaling strengthening upside momentum
• Volume surged to 55.45M shares, indicating strong institutional participation
• The stock has rallied sharply from the April lows near 28–30
• Current price action suggests momentum expansion rather than a short-term relief bounce
Trend Structure: From Extended Correction to Recovery Breakout
Phase 1 — Speculative Expansion & Volatility (Oct – Dec 2025)
IONQ experienced intense momentum-driven volatility during late 2025 as enthusiasm surrounding Quantum Computing and emerging AI technologies accelerated.
During this period:
- Price surged aggressively above moving averages
• RSI repeatedly entered overbought territory
• Volume expanded sharply during breakout sessions
• Speculative momentum pushed shares toward the 80 region
However, the rally eventually became unstable as profit-taking pressure intensified.
Phase 2 — Prolonged Correction & Capitulation (Jan – Apr 2026)
Following the late-2025 peak, IONQ entered a deep corrective structure:
- Lower highs and lower lows developed consistently
• EMA-21 rolled below price and trended downward
• Selling pressure intensified during failed rallies
• Price eventually collapsed toward the 28–30 support zone
Momentum weakened substantially as speculative Growth Stocks came under broader pressure.
Importantly, the April lows began showing early signs of stabilization rather than continued breakdown.
Phase 3 — Recovery Acceleration & Momentum Expansion (Apr – May 2026)
The current phase represents a major technical improvement.
IONQ has now:
- Reclaimed both EMA-21 and EMA-50 decisively
• Formed higher highs and higher lows
• Produced multiple breakout candles with expanding volume
• Accelerated sharply following recent consolidation
Today’s strong double-digit rally strongly suggests renewed institutional Demand rather than temporary short-covering activity.
Moving Averages: Bullish Trend Structure Reestablished
The moving-average structure has shifted decisively bullish.
EMA-21 (49.57)
- Rising sharply upward
• Acting as immediate trend support
• Successfully supported recent pullbacks
EMA-50 (44.44)
- Now turning higher after months of weakness
• Reinforces the medium-term recovery trend
• Sits comfortably below current price, reflecting improving momentum strength
The widening distance between current price and moving averages confirms strong upside acceleration, although short-term volatility may increase after such a rapid advance.
Momentum Analysis: RSI Signals Strong Bullish Expansion
RSI-10 at 66.14 reflects strengthening bullish momentum without yet reaching extreme overbought conditions.
Current RSI behavior suggests:
- Buyers remain firmly in control
• Momentum is accelerating rather than fading
• The breakout still has room for continuation before exhaustion risks rise materially
A sustained RSI move above 70 could indicate an even stronger momentum expansion phase ahead.
Volume Analysis: Institutional Participation Appears Active
Volume behavior strongly confirms the validity of the breakout.
Key observations include:
- Today’s rally occurred on exceptionally elevated volume
• Recent up-days have consistently shown stronger participation than down-days
• Volume spikes aligned with major breakout candles and recovery pivots
This type of price-volume behavior is commonly associated with:
- Institutional accumulation
• Momentum-driven growth inflows
• High-conviction speculative buying
At present, the rally appears demand-driven rather than purely retail speculation.
Key Technical Levels
Resistance Levels
- 60–62 — immediate breakout resistance zone
• 68–70 — major momentum expansion target
• 78–80 — prior speculative peak region
Support Levels
- 52–50 — recent breakout support
• EMA-21 at 49.57 — primary dynamic support
• EMA-50 at 44.44 — medium-term structural support
• 38–40 — prior consolidation zone
Scenario Analysis
- Bullish Continuation (Primary Case)
If IONQ sustains above the 52–50 breakout region:
→ Momentum could extend toward 68–70
→ RSI may enter sustained bullish territory above 70
→ Quantum computing momentum could continue attracting institutional inflows
- Consolidation Phase (Healthy Outcome)
Following the sharp rally, the stock may enter temporary consolidation:
→ Sideways range between 50–60
→ RSI cools gradually
→ EMA-21 catches up beneath price
This would strengthen the broader bullish structure.
- Bearish Reversal (Risk Case)
A failed breakout below 50 with heavy selling volume could trigger profit-taking pressure:
→ First downside target near EMA-50 at 44
→ Momentum structure would weaken materially below 44
→ Broader recovery thesis would deteriorate if selling accelerates aggressively
Currently, this remains a secondary scenario.
Conclusion: IONQ Reclaims High-Momentum Leadership Status
IonQ is rapidly transitioning from prolonged correction territory back into high-growth momentum leadership within the emerging quantum computing space.
The technical structure now reflects:
- Strong bullish moving-average alignment
• Explosive recovery momentum
• Institutional-quality volume expansion
• Higher highs and higher lows
• Renewed speculative growth leadership behavior
The framework moving forward is becoming increasingly clear:
- Above 50–52 → bullish momentum remains dominant
• Above 60 → breakout acceleration likely strengthens further
• Below EMA-21 → near-term caution increases
For momentum traders and growth investors, IONQ is once again behaving like a leading next-generation technology momentum stock, with current price action suggesting institutional demand has returned aggressively following months of correction and consolidation.
_06_11_2026_12_45_08_746277.jpg)


 Please wait processing your request...