
Key Highlights
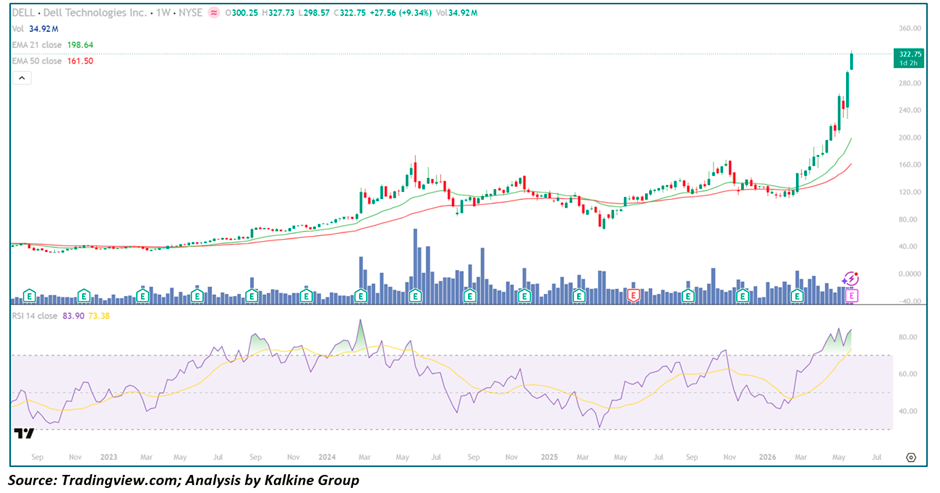
- DELL closed at $322.75, surging +$27.56 (+9.34%) on the week in one of the most powerful single-week candles in the stock's entire visible chart history
- Price traded between $298.57 and $327.73 on the weekly candle, reflecting an extraordinary range expansion and dominant institutional buying conviction
- Price trades $124.11 above EMA-21 ($198.64) and $161.25 above EMA-50 ($161.50) — an extreme and historic separation from both moving averages reflecting a genuine parabolic advance
- RSI-14 closed at 83.90 with the signal line at 73.38 — deeply overbought territory with a powerful bullish configuration where RSI leads the signal aggressively higher, confirming explosive momentum continuation
- Volume at 34.92M represents one of the most significant weekly volume prints in the visible chart, confirming the most recent leg of this breakout is driven by serious institutional Capital deployment
- DELL has advanced from lows near $35–$40 in late 2022 to current highs above $320 — an extraordinary multi-year gain of over 700% across the full visible chart period
- The most recent May 2026 Earnings catalyst has triggered the most vertical and aggressive phase of the entire advance, lifting DELL from the $120–$130 consolidation zone to current levels in a matter of weeks
Trend Structure: From Deep Value Recovery to Multi-Phase AI-Driven Institutional Uptrend
Phase 1 — Slow Accumulation and Base Building (Sep 2022 – Mid 2023)
DELL entered the visible chart period at deeply depressed valuations, offering institutional value investors an extraordinary entry opportunity:
- Price oscillated in the $35–$50 range through late 2022 and into early 2023, with EMA-21 and EMA-50 running in close proximity as the stock formed a lengthy and disciplined base
- Volume was modest and consistent during this period, reflecting patient institutional accumulation rather than aggressive momentum buying
- RSI recovered gradually from sub-40 oversold territory toward the 50–60 neutral zone, signalling that the worst of the structural selling pressure had passed
- The initial breakout from the base triggered the first meaningful upside expansion in the stock, launching price from $50 toward the $70–$80 zone with EMA-21 crossing decisively above EMA-50
- This early phase established the foundational bullish alignment that would support a far more powerful advance in subsequent phases
Phase 2 — First Acceleration Cycle and Peak (Mid 2023 – Late 2023)
From the established base, DELL delivered its first powerful trending advance driven by early recognition of the company's AI server infrastructure opportunity:
- Price advanced sharply from the $50 breakout to highs near $70–$80 by mid-2023, with RSI reaching overbought territory near 75–80 during the most aggressive phase of the advance
- Volume spiked meaningfully during earnings events, confirming that fundamental data was validating the institutional thesis
- A natural consolidation followed, pulling price back toward the $80–$100 zone before buyers re-engaged — the healthy digestion pattern of a genuine institutional uptrend
- EMA-21 and EMA-50 maintained rising alignment throughout, with pullbacks consistently finding support at the dynamic averages
Phase 3 — AI Infrastructure Re-Rating and Explosive Vertical Advance (2024 – Present)
The third and most dramatic phase of the DELL advance reflects the market's full recognition of the company's central role in AI infrastructure buildout:
- From 2024 onwards, DELL began a materially steeper and more structurally significant advance as AI server Demand from hyperscalers and enterprise customers accelerated dramatically
- Price broke through the $100 and then $120–$130 barriers with increasing momentum, establishing new all-time highs at every stage of the advance
- The February–March 2025 period brought a brief but sharp earnings-driven correction that briefly tested the $80 zone — representing the single most significant pullback of the entire advance — before buyers returned aggressively and price recovered to new highs
- The 2026 advance has been the most vertical and parabolic phase of the entire multi-year trend, with DELL accelerating from $130 to $200, $250, $300, and now $322 in a compressed timeframe reflecting an institutional re-rating of extraordinary magnitude
Moving Averages: Historic Separation Reflects Parabolic Institutional Re-Rating
EMA-21 ($198.64)
- Price trades an extraordinary $124 above this average — a separation that reflects the vertical nature of the current advance and the speed at which institutional capital has been redeployed into DELL
- The EMA-21 is rising steeply but cannot keep pace with the current rate of price appreciation, confirming the parabolic character of the move
- Any reversion toward the EMA-21 would represent a correction of approximately 38% from current levels — a scenario that, while unlikely in the immediate term, represents the natural long-term mean reversion risk of parabolic advances
EMA-50 ($161.50)
- The EMA-50 trades $161 below current price — a separation of over 50% between price and its 50-week average, reflecting the full scale of the institutional Revaluation underway
- The rising slope of the EMA-50 from its long-term base confirms the durability of the broader multi-year trend beneath the current explosive move
Momentum Analysis: RSI at Extreme Overbought Levels Confirms Parabolic Momentum
RSI-14 at 83.90 with the signal line at 73.38 delivers the clearest possible momentum signal — this stock is in a state of extreme institutional momentum:
- At 83.90, the RSI is operating in territory that has historically been associated only with the most powerful and sustained institutional buying episodes in large-cap technology
- The RSI line leads the signal line by over 10 points — a bullish momentum configuration of the highest order, confirming acceleration rather than exhaustion
- Prior RSI peaks near 80+ on DELL's Weekly Chart in mid-2023 were followed by brief but sharp consolidation phases — the current overbought reading warrants awareness of near-term consolidation risk even within the broader bullish structure
Volume Analysis: Institutional Capital Deployment at Historic Scale
- The most recent weekly volume of 34.92M represents one of the largest weekly volume prints in the visible chart, confirming the May 2026 earnings catalyst has triggered a genuine institutional repositioning event
- The consistent pattern of earnings events generating volume spikes followed by sustained directional trend continuation confirms that fundamental data is the primary driver of DELL's institutional narrative
- No distribution signals are visible at current levels — the volume pattern is consistent with aggressive institutional accumulation rather than selling into strength
Key Technical Levels
Resistance: $330–$340 (near-term extension) → $360 (chart high target) → $400 (longer-term psychological extension)
Support: $280–$290 (immediate) → $240–$250 (prior breakout zone) → $198 (EMA-21)
Conclusion
Dell Technologies has delivered one of the most extraordinary multi-year institutional re-rating events in large-cap technology — advancing over 700% from its 2022 lows as the market has progressively recognised the company's defining role in the AI infrastructure supercycle. The May 2026 earnings catalyst has triggered the most explosive single phase of the entire advance, lifting DELL to historic all-time highs above $320 with RSI in deeply overbought territory and price trading at a historic distance above both moving averages. While the parabolic nature of the current advance introduces near-term mean reversion risk, the depth and consistency of institutional commitment visible across the entire chart period confirms that DELL's structural re-rating as a premier AI infrastructure beneficiary remains the dominant fundamental and technical thesis.
_06_11_2026_12_45_08_746277.jpg)


 Please wait processing your request...