
 CA
 NZ
 UK
 AU
 IND

 US

 Share
 X (Formerly Twitter)
 Whatsapp
 Facebook
 LinkedIn
 Telegram
 Email This Article
 Copy Link
 Summarize with AI
 Chat GPT
 Perplexity

The crypto-equity complex saw a sharp, broadly synchronized rebound today, led by the bitcoin miners. Marathon Digital (NASDAQ: MARA), Bitdeer (NASDAQ: BTDR), TeraWulf (NASDAQ: WULF), Cipher Mining (NASDAQ: CIFR), CleanSpark (NASDAQ: CLSK), HIVE Digital (NASDAQ: HIVE), and Core Scientific-adjacent small-cap KEEL Holdings (NASDAQ: KEEL) all posted gains between roughly 5% and 13%, several bouncing directly off Fibonacci or trendline support after multi-week pullbacks from June highs. Coinbase (NASDAQ: COIN), Hut 8 (NASDAQ: HUT), and MicroStrategy (NASDAQ: MSTR) also finished green, but with far more muted moves, and all three remain below their key moving averages after steeper, longer-running declines.
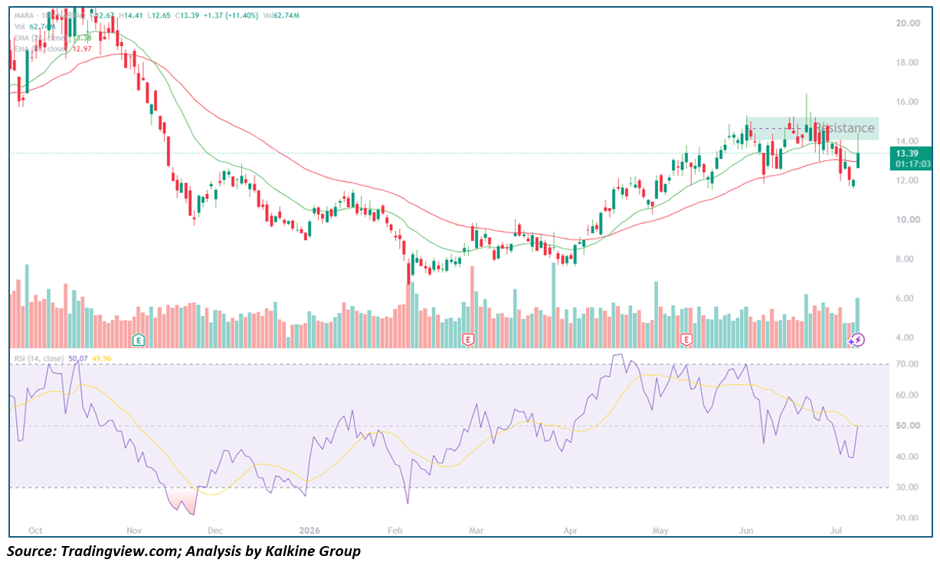
Marathon Digital (NASDAQ: MARA) — Strong Reversal Testing Prior Resistance Zone
Key Highlights
- MARA trading at $13.39, up 11.40% ($1.37) on volume of 62.74M shares, after ranging between $12.65 and $14.41.
- Price has reclaimed both the 20-day EMA ($13.38) and the 50-day EMA ($12.97), with the shorter average now essentially at spot.
- RSI has jumped to roughly 50.1, with the signal line at 50.0, snapping back to neutral after a decline from overbought levels above 70 in May and June.
- MARA rallied from around $8 in April 2026 to a peak near $16 in June, running directly into a horizontal resistance zone between roughly $14 and $16, before pulling back to a recent low near $11.
- Today's session is the largest single-day gain since the April breakout began.
Trend Structure MARA's chart shows a deep 2025 decline into a November low near $7, a long basing period through Q1 2026, and a strong breakout from April that carried price into a well-defined resistance shelf. The recent pullback tested support just above the 50-day EMA, and today's sharp reversal, on heavy volume, brings price right back to the lower edge of that resistance zone.
Key Technical Levels
Resistance
- $14.00–16.00 – Prior resistance shelf
- $14.41 – Today's high
Support
- $13.38 – 20-day EMA
- $12.97 – 50-day EMA
- $11.00 – Recent pullback low
Outlook A decisive close back above the $14–16 resistance shelf would confirm the April uptrend has resumed. Failure to clear that zone would likely see price rotate back toward the EMA cluster near $13.
Bitdeer Technologies (NASDAQ: BTDR) — Sharpest Bounce in the Group, Still Below Both Moving Averages
Key Highlights
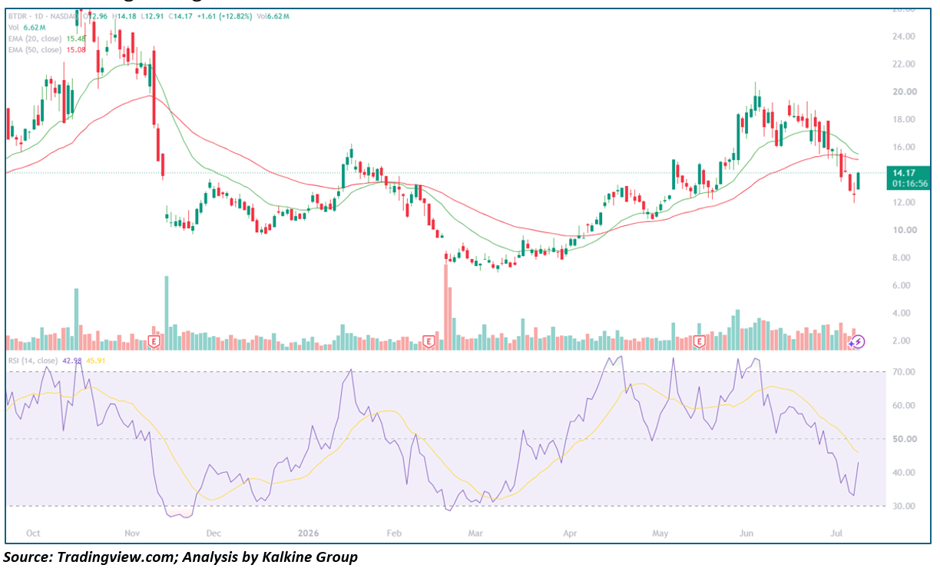
- BTDR trading at $14.17, up 12.82% ($1.61) on volume of 6.62M shares, after ranging between $12.91 and $14.18.
- Price remains below both the 20-day EMA ($15.48) and the 50-day EMA ($15.08).
- RSI has rebounded to roughly 43.0, with the signal line at 45.9, recovering from a steady decline off overbought territory in June.
- BTDR rallied from a March low near $8 to a peak near $21 in June, then pulled back sharply to current levels.
- Today's gain is the largest single-day move of the past several months.
Trend Structure BTDR's chart has been volatile throughout the past year, with sharp advances and equally sharp retracements. The June rally to $21 was followed by a steady grind lower into July, and today's outsized bounce is a first sign of stabilization, though price has yet to reclaim either moving average.
Key Technical Levels
Resistance
- $15.08 – 50-day EMA
- $15.48 – 20-day EMA
- $21.00 – June 2026 high
Support
- $12.91 – Today's low
- $8.00 – March 2026 low
Outlook BTDR needs a close back above both EMAs to suggest the pullback from June's highs is complete. Until then, today's move is best read as an oversold bounce within a still-corrective structure.
TeraWulf (NASDAQ: WULF) — Bounce Off Long-Standing Rising Trendline After Pullback From Highs
Key Highlights
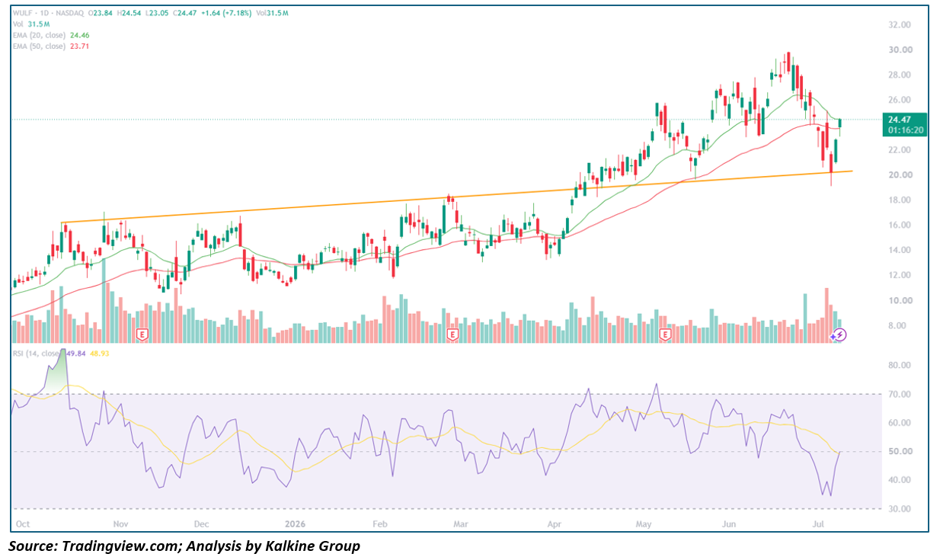
- WULF trading at $24.47, up 7.18% ($1.64) on volume of 31.5M shares, after ranging between $23.05 and $24.54.
- Price has reclaimed the 20-day EMA ($24.46) and sits above the 50-day EMA ($23.71).
- RSI has recovered to roughly 49.8, with the signal line at 48.9, bouncing off an oversold dip below 40 earlier this week.
- WULF has been in a persistent uptrend since October 2025, rallying from around $16 to a peak near $30 in June, with a rising trendline connecting the lows along the way.
- Today's session found support directly at that trendline before reversing sharply higher.
Trend Structure WULF's advance has been one of the steadiest in the group, built on a long, well-respected rising trendline. The pullback from June's high tested that trendline for the first time in months, and today's strong bounce — reclaiming both EMAs — suggests the line is holding.
Key Technical Levels
Resistance
- $26.00 – Recent swing high area
- $30.00 – June 2026 high
Support
- $24.46 – 20-day EMA
- $23.71 – 50-day EMA
- ~$20.00 – Rising trendline (current level)
Outlook As long as WULF holds above its rising trendline, the broader uptrend from October remains intact. A close back above $26 would open the door to a retest of the June high near $30.
Cipher Mining (NASDAQ: CIFR) — Rebound From 0.5 Fibonacci Support, Reclaiming Short-Term Average
Key Highlights
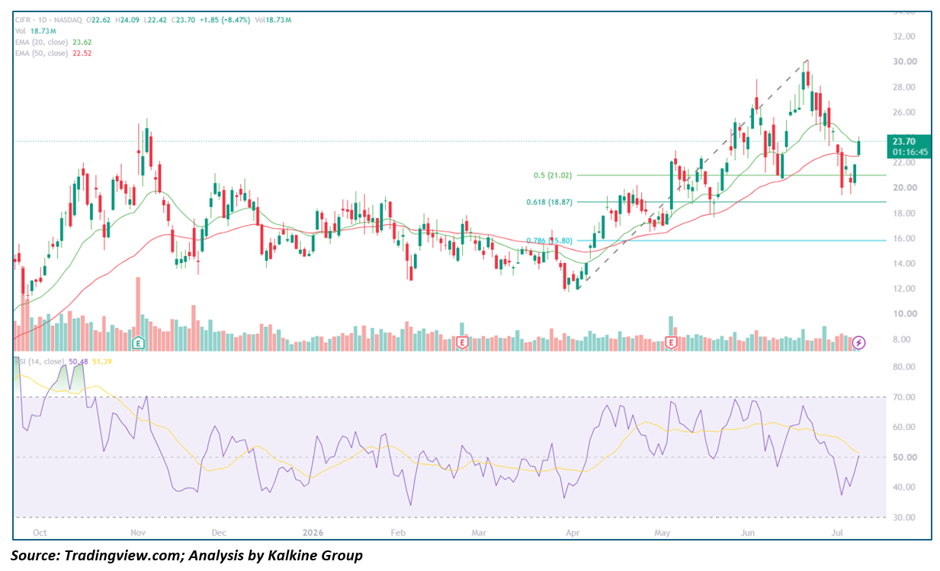
- CIFR trading at $23.70, up 8.47% ($1.85) on volume of 18.73M shares, after ranging between $22.42 and $24.09.
- Price has moved back above the 20-day EMA ($23.62) and remains above the 50-day EMA ($22.52).
- RSI has bounced to roughly 50.5, with the signal line at 51.4, recovering from a decline off overbought levels above 70 in May and June.
- CIFR rallied from an April low near $11 to a peak near $30 in June, then retraced into the 0.5 Fibonacci retracement zone near $21.02 before today's reversal.
- Today's gain is among the strongest single-day moves since the April breakout began.
Trend Structure CIFR's chart shows a powerful advance off the April lows, nearly tripling into the June peak. The pullback since then found buyers almost exactly at the 0.5 retracement level, and today's sharp bounce back above both EMAs is a constructive sign for the broader uptrend.
Key Technical Levels
Resistance
- $24.09 – Today's high
- $30.00 – June 2026 high
Support
- $23.62 – 20-day EMA
- $22.52 – 50-day EMA
- $21.02 – 0.5 Fibonacci retracement
- $18.87 – 0.618 Fibonacci retracement
Outlook Holding above the 0.5 Fibonacci level and both EMAs keeps the April uptrend structurally intact. A break back below $21 would shift focus to the 0.618 retracement near $18.87.
CleanSpark (NASDAQ: CLSK) — Bounce Off 50-Day EMA After Retreat From June Highs
Key Highlights
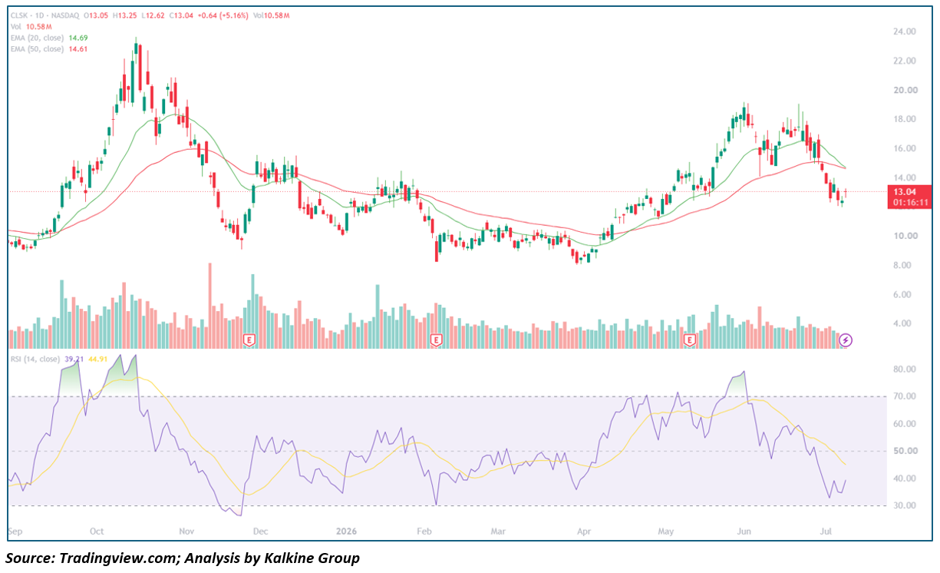
- CLSK trading at $13.04, up 5.16% ($0.64) on volume of 10.58M shares, after ranging between $12.62 and $13.25.
- Price remains just below both the 20-day EMA ($14.69) and the 50-day EMA ($14.61), which have converged.
- RSI has bounced to roughly 39.2, with the signal line at 44.9, recovering from an oversold reading after a decline off overbought territory above 70 in June.
- CLSK peaked near $22 in October 2025, fell to a low near $8 in February 2026, rallied to a secondary peak near $19 in June, and has since pulled back to current levels.
- Today's bounce comes directly off a test of the converged EMAs.
Trend Structure CLSK's year has been choppy, with two distinct rally-and-retrace cycles — one into October 2025 and another into June 2026 — separated by a deep February low. The current pullback from June's high has brought price down to test the converged 20- and 50-day EMAs, a level that has acted as a pivot point in the past.
Key Technical Levels
Resistance
- $14.61–14.69 – Converged 20/50-day EMAs
- $19.00 – June 2026 high
Support
- $12.62 – Today's low
- $8.00 – February 2026 low
Outlook A close back above the EMA cluster near $14.60–14.70 would be the first technical sign the pullback from June is ending. Failure to hold today's low would put the broader base-building range back in focus.
HIVE Digital Technologies (NASDAQ: HIVE) — Stabilizing Near 0.5 Fibonacci Support Below Both EMAs
Key Highlights
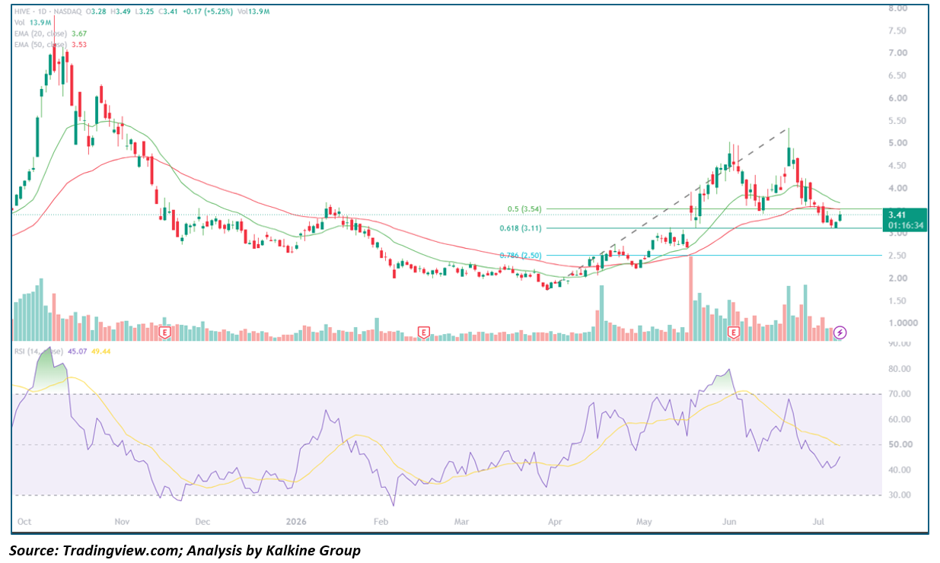
- HIVE trading at $3.41, up 5.25% ($0.17) on volume of 13.9M shares, after ranging between $3.25 and $3.49.
- Price remains below both the 20-day EMA ($3.67) and the 50-day EMA ($3.53).
- RSI has bounced to roughly 45.1, with the signal line at 49.4, recovering from a decline off overbought levels above 70 in June.
- HIVE fell from around $7 in October 2025 to a low near $1.50 in February 2026, then rallied sharply to a peak near $5.20 in June before retracing to the 0.5 Fibonacci level near $3.54.
- Today's bounce comes with price hovering just below that retracement level.
Trend Structure HIVE's chart mirrors the broader miner complex: a steep 2025 decline, a February base, and a powerful rally into June that has since given back a meaningful portion of its gains. Price is now consolidating just under the 0.5 Fibonacci retracement, with the 0.618 level near $3.11 as the next support zone below.
Key Technical Levels
Resistance
- $3.53 – 50-day EMA
- $3.54 – 0.5 Fibonacci retracement
- $3.67 – 20-day EMA
Support
- $3.11 – 0.618 Fibonacci retracement
- $2.50 – 0.786 Fibonacci retracement
Outlook Reclaiming the $3.54 level and both EMAs would support the case that the pullback from June's highs is nearing an end. A break below $3.11 would point to a deeper retracement toward the $2.50 zone.
KEEL Holdings (NASDAQ: KEEL) — Rebound Off 50-Day EMA Support After Sharp Retreat From June Peak
Key Highlights
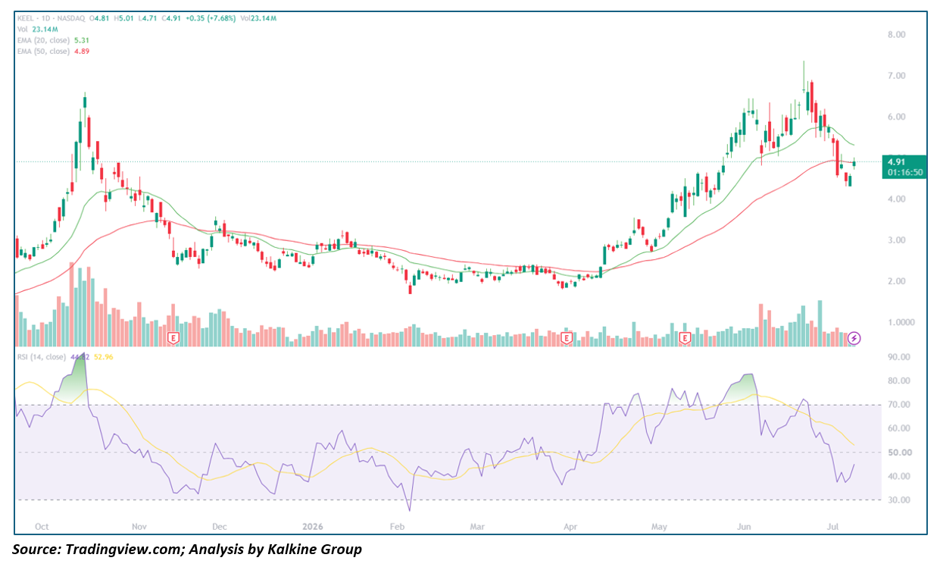
- KEEL trading at $4.91, up 7.68% ($0.35) on volume of 23.14M shares, after ranging between $4.71 and $5.01.
- Price remains below the 20-day EMA ($5.31) but has reclaimed the 50-day EMA ($4.89) from below.
- RSI has bounced to roughly 44.8, with the signal line at 53.0, recovering from a sharp decline off overbought levels above 80 in June.
- KEEL rallied from an April low near $2 to a peak near $7.50 in June, then fell sharply to a recent low near $4.30 before today's rebound.
- Today's gain is one of the stronger single-day moves since the April breakout.
Trend Structure KEEL's advance since April has been the steepest in percentage terms among this group, nearly quadrupling into the June high. The subsequent pullback has been proportionally sharp as well, and today's bounce off the 50-day EMA is an encouraging, if early, sign of stabilization.
Key Technical Levels
Resistance
- $5.31 – 20-day EMA
- $7.50 – June 2026 high
Support
- $4.89 – 50-day EMA
- $4.30 – Recent pullback low
Outlook Holding above the 50-day EMA keeps the April uptrend intact on a near-term basis. A close back above the 20-day EMA near $5.31 would strengthen the case for a resumption of the broader rally.
Coinbase Global (NASDAQ: COIN) — Modest Bounce Within a Persistent Downtrend Below Both EMAs
Key Highlights
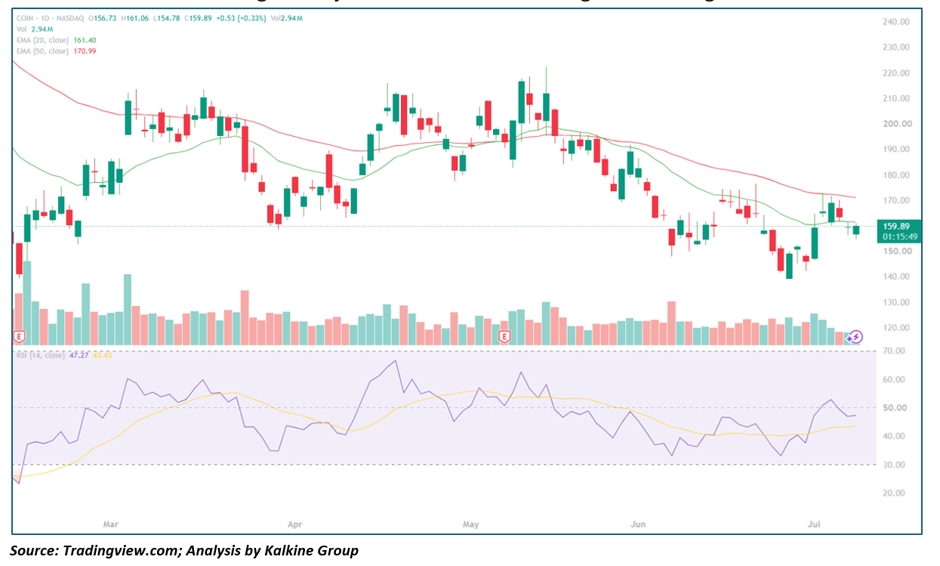
- COIN trading at $159.89, up 0.33% ($0.53) on volume of 2.94M shares, after ranging between $154.78 and $161.06.
- Price remains below both the 20-day EMA ($161.40) and the 50-day EMA ($170.99).
- RSI sits at roughly 47.3, with the signal line at 43.4, modestly recovering after a decline from a May peak above 60.
- COIN has traded in a broad, choppy range roughly between $145 and $220 since February 2026, with a failed rally attempt in May topping out near $220 before a steady slide into July lows near $145.
- Today's gain is minor relative to the size of the recent decline.
Trend Structure Unlike the miners, COIN has not staged a strong reversal — its chart shows a rounded top forming since the May peak, with lower highs and a steady grind toward the lower end of its multi-month range. Today's small bounce comes right at the range floor.
Key Technical Levels
Resistance
- $161.40 – 20-day EMA
- $170.99 – 50-day EMA
- $220.00 – May 2026 high
Support
- $145.00 – Recent range low
Outlook COIN needs a close back above the 20-day EMA to suggest the slide from May's highs is stabilizing. Continued weakness below $145 would risk a break of the multi-month range floor.
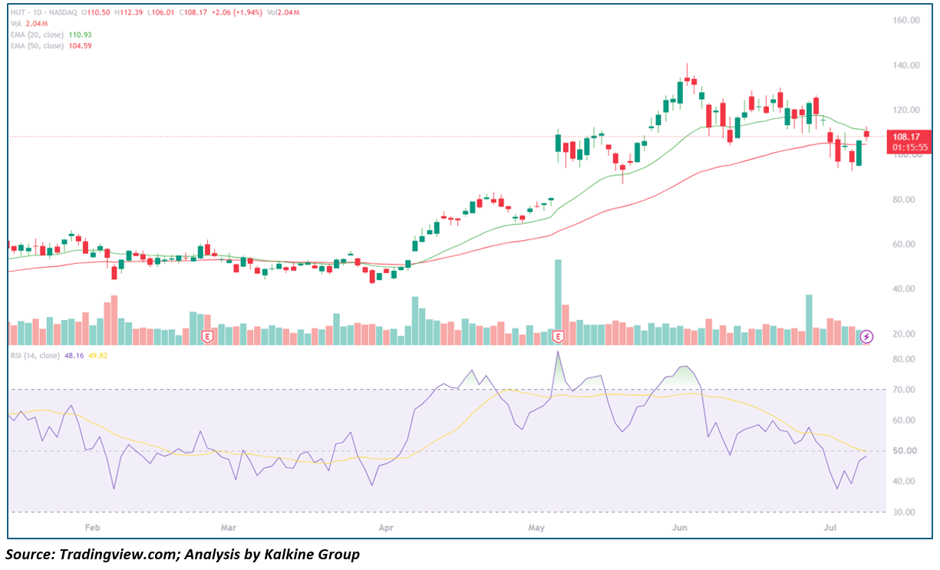
Hut 8 Corp (NASDAQ: HUT) — Consolidating Below Both EMAs After Sharp Pullback From June Peak
Key Highlights
- HUT trading at $108.17, up 1.94% ($2.06) on volume of 2.04M shares, after ranging between $106.01 and $112.39.
- Price remains below both the 20-day EMA ($110.93) and the 50-day EMA ($104.59), though it is testing the 20-day average from below.
- RSI sits at roughly 48.2, with the signal line at 49.8, near neutral after a decline from overbought levels above 70 in May and June.
- HUT rallied from around $50 in April 2026 to a peak near $140 in June, then pulled back sharply into current levels.
- Today's modest gain continues a stabilization attempt following the recent decline.
Trend Structure HUT's advance since April was the most powerful in absolute percentage terms among the larger-cap names in this group, more than doubling into its June peak. The pullback since has been steep but has so far held above the 50-day EMA, keeping the broader uptrend technically intact.
Key Technical Levels
Resistance
- $110.93 – 20-day EMA
- $140.00 – June 2026 high
Support
- $104.59 – 50-day EMA
- $95.00 – Recent pullback low
Outlook A close back above the 20-day EMA would support the case that the correction from June's highs is ending. Losing the 50-day EMA would open the door to a deeper retracement toward the April breakout zone.
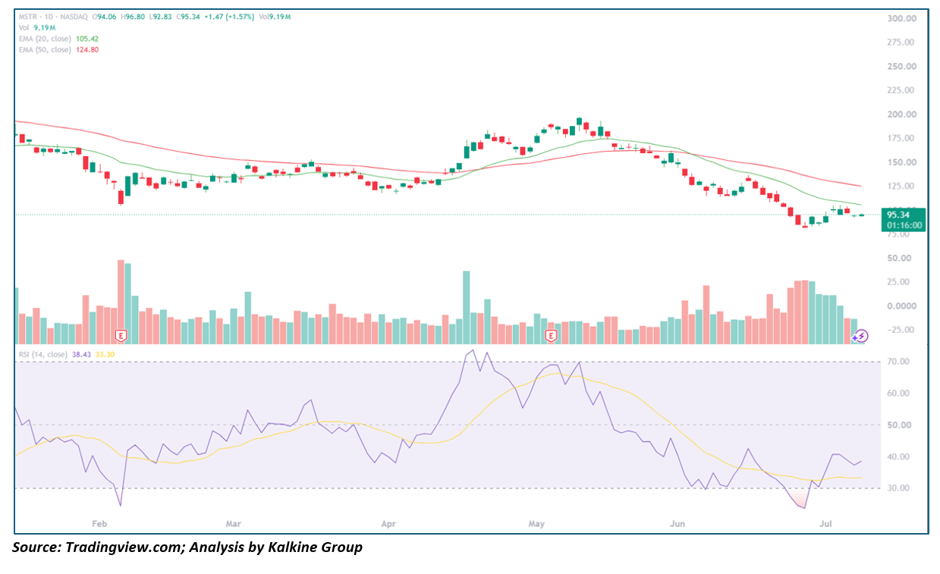
MicroStrategy (NASDAQ: MSTR) — Weakest Chart in the Group, Bouncing Off Multi-Month Lows
Key Highlights
- MSTR trading at $95.34, up 1.57% ($1.47) on volume of 9.19M shares, after ranging between $92.83 and $96.80.
- Price remains well below both the 20-day EMA ($105.42) and the 50-day EMA ($124.80).
- RSI sits at roughly 38.4, with the signal line at 33.3, recovering from an oversold reading below 30 in late June.
- MSTR declined from around $195 in January 2026 to a March low near $125, rallied to a secondary peak near $200 in May, and has since fallen sharply to fresh lows near $90 in early July.
- Today's bounce is modest and comes directly off those multi-month lows.
Trend Structure MSTR has been the technical laggard of this group, with a pattern of lower highs since January and a steep, largely uninterrupted decline since the May peak. The stock remains deeply below both moving averages, and today's small bounce has yet to produce any meaningful technical improvement.
Key Technical Levels
Resistance
- $105.42 – 20-day EMA
- $124.80 – 50-day EMA
- $200.00 – May 2026 high
Support
- $90.00 – Early-July 2026 low
- $92.83 – Today's low
Outlook MSTR needs a sustained move back above the 20-day EMA to suggest the downtrend from May is ending. Until then, this remains the weakest chart in the group, with the July low the key level to watch on any renewed selling.
This analysis is based on daily chart technical indicators (20/50-day EMAs, RSI-14, and Fibonacci retracements) and price action as of July 9, 2026, and is intended for informational purposes only — not investment advice.


 Nov 18, 2026





 Please wait processing your request...