_05_22_2026_02_26_28_997133.jpg)
Key Highlights
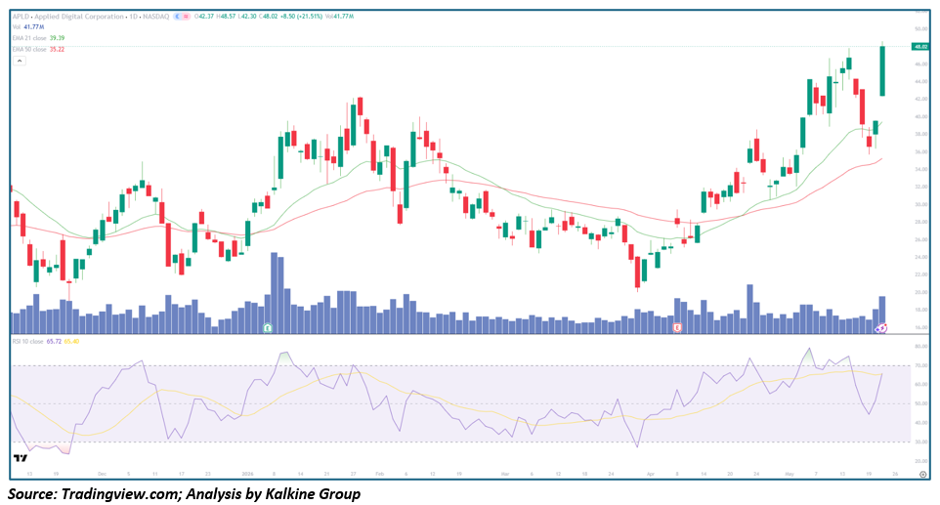
- APLD closed at 48.02, surging +21.51% in a major breakout session
• Price traded between 42.30 and 48.57 intraday, reflecting aggressive upside momentum
• The stock is trading firmly above the EMA-21 (39.39) and EMA-50 (35.22), confirming strong bullish trend alignment
• RSI-10 climbed toward 65.72, signaling accelerating momentum strength
• Volume surged sharply to 41.77M shares, indicating strong institutional participation
• The stock has rallied aggressively from the April lows near 21–23
• Current price action suggests momentum expansion rather than speculative short-covering alone
Trend Structure: From Consolidation Base to Momentum Breakout
Phase 1 — Volatility & Wide Trading Range (Nov 2025 – Feb 2026)
APLD spent several months trading within a highly volatile consolidation structure following earlier speculative rallies.
During this phase:
- Price swings became increasingly unstable
• EMA-21 and EMA-50 repeatedly crossed during consolidation
• Momentum lacked sustained directional control
• Volume spikes appeared during both rallies and selloffs
Despite volatility, the stock gradually began building a broader accumulation structure.
Phase 2 — Correction & Base Formation (Feb – Apr 2026)
The stock later entered a corrective phase that helped reset momentum conditions.
Key developments included:
- Price retraced toward the low-20 region
• RSI cooled significantly from prior overbought conditions
• Selling pressure gradually weakened
• Support stabilized near the April lows
Importantly, the correction transitioned into stabilization rather than a complete structural breakdown.
Phase 3 — Recovery Acceleration & Breakout Expansion (Apr – May 2026)
The current phase reflects a decisive technical breakout.
APLD has now:
- Reclaimed both EMA-21 and EMA-50 aggressively
• Formed strong higher highs and higher lows
• Produced multiple breakout candles with expanding volume
• Accelerated vertically following recent consolidation
Today’s explosive rally strongly suggests institutional momentum participation rather than temporary speculative activity.
Moving Averages: Bullish Trend Structure Strengthens
The moving-average structure has shifted decisively bullish.
EMA-21 (39.39)
- Rising aggressively upward
• Acting as immediate trend support
• Successfully supported recent pullbacks
EMA-50 (35.22)
- Now turning sharply higher
• Reinforces the medium-term recovery trend
• Sits comfortably below current price, confirming momentum acceleration
The expanding gap between current price and moving averages reflects strong upside momentum, though it also increases the probability of short-term volatility after such a rapid advance.
Momentum Analysis: RSI Signals Strong Expansion Momentum
RSI-10 near 65.72 reflects strong bullish momentum without yet reaching extreme overbought conditions.
Current RSI behavior suggests:
- Buyers remain firmly in control
• Momentum is accelerating rather than weakening
• The breakout still has room for continuation before exhaustion risks increase materially
If RSI pushes sustainably above 70, momentum expansion could intensify further.
Volume Analysis: Institutional Participation Appears Aggressive
Volume behavior strongly validates the breakout structure.
Key observations include:
- Today’s breakout occurred on exceptionally strong volume
• Recent up-days have consistently shown stronger participation than down-days
• Volume spikes aligned closely with breakout candles and momentum acceleration
This type of price-volume behavior is commonly associated with:
- Institutional accumulation
• AI-sector momentum inflows
• High-conviction breakout buying activity
At present, the rally appears Demand-driven rather than purely speculative.
Key Technical Levels
Resistance Levels
- 48–50 — immediate breakout resistance zone
• 55–58 — momentum expansion target
• 65–70 — long-term breakout extension zone
Support Levels
- 42–40 — recent breakout support
• EMA-21 at 39.39 — primary dynamic support
• EMA-50 at 35.22 — medium-term structural support
• 30–32 — prior consolidation region
Scenario Analysis
- Bullish Continuation (Primary Case)
If APLD sustains above the 40–42 breakout zone:
→ Momentum could extend toward 55–60
→ RSI may enter sustained overbought territory
→ AI infrastructure demand could continue driving institutional inflows
- Consolidation Phase (Healthy Outcome)
After the sharp breakout, the stock may temporarily consolidate:
→ Sideways range between 40–48
→ RSI cools gradually
→ EMA-21 catches up beneath price
This would reinforce the broader bullish structure.
- Bearish Reversal (Risk Case)
A failed breakout below 40 with heavy selling pressure could trigger profit-taking:
→ First downside target near EMA-50 at 35
→ Momentum structure would weaken materially below 35
→ Institutional momentum participation could slow significantly
Currently, this remains a secondary scenario.
Conclusion: APLD Reclaims High-Momentum AI Infrastructure Leadership
Applied Digital is rapidly transitioning from consolidation territory back into high-momentum leadership within the AI infrastructure and digital compute space.
The technical structure now reflects:
- Strong bullish moving-average alignment
• Explosive breakout momentum
• Institutional-quality volume expansion
• Higher highs and higher lows
• Renewed speculative growth leadership characteristics
The framework moving forward is becoming increasingly clear:
- Above 40–42 → bullish momentum remains dominant
• Above 50 → breakout acceleration likely strengthens further
• Below EMA-21 → near-term caution increases materially
For momentum traders and growth-focused investors, APLD is once again behaving like a leading AI infrastructure momentum stock, with current price action suggesting institutional demand has returned aggressively following months of consolidation and corrective volatility.
_06_11_2026_12_45_08_746277.jpg)


 Please wait processing your request...