
Key Highlights
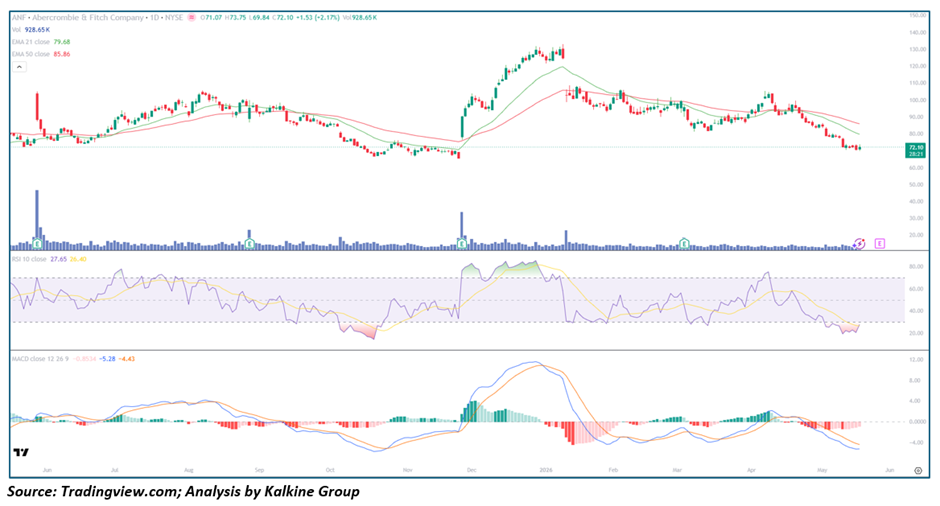
- Abercrombie & Fitch is trading near $72.10, under sustained pressure after a prolonged downtrend
• Stock has broken below both EMA-21 (~$79.68) and EMA-50 (~$85.86), confirming a bearish structure
• RSI-10 at ~27 signals deeply oversold conditions, often a precursor to relief rallies
• MACD remains in negative territory, but downside momentum is starting to flatten
• Volume remains moderate, suggesting selling pressure may be stabilizing rather than accelerating
Trend Structure: Extended Downtrend Approaches Exhaustion
Abercrombie & Fitch has been in a clear downtrend since early 2026, falling sharply from highs near $130 to the current ~$72 level — a steep correction of over 40%. The structure shows consistent lower highs and lower lows, with price trading below both key moving averages throughout the decline.
However, the pace of the decline has started to slow in recent sessions, with price attempting to stabilize around the $70–$72 zone. This area is emerging as a potential short-term base as sellers show signs of fatigue. While the broader trend remains bearish, the setup is transitioning from impulsive selling to possible consolidation.
Oversold Setup: Mean Reversion Potential Builds
The most notable feature on the chart is the RSI-10 reading near 27, which places the stock firmly in oversold territory — one of the lowest readings in recent months. Historically, such conditions often lead to short-term bounce or mean reversion rallies.
At the same time, the MACD remains negative but is beginning to flatten, indicating that downside momentum may be losing strength. This combination — deeply oversold RSI and stabilizing MACD — often marks the early stages of a potential Reversal or at least a tradable bounce.
Moving Averages: Resistance Overhead Remains Key
The Moving Average structure continues to act as a ceiling:
• EMA-21 (~$79.68) — immediate resistance; first level bulls must reclaim
• EMA-50 (~$85.86) — stronger resistance; defines broader trend
Unless price reclaims the EMA-21, rallies are likely to face selling pressure. However, any sustained move back above $80 would be the first signal that the downtrend is weakening and that a trend transition could be underway.
Momentum & Volume: Selling Pressure Easing
Momentum indicators suggest the worst of the selling may be behind:
• RSI deeply oversold but attempting to curl higher
• MACD histogram showing signs of contraction
• Volume not expanding on recent declines — a sign that panic selling is absent
This points toward a market that is no longer aggressively selling, increasing the probability of a short-term bounce.
Key Technical Levels and Scenarios
Resistance Levels
• $79–$80 — EMA-21 and immediate breakout level
• $85–$86 — EMA-50 and trend reversal zone
• $95+ — prior consolidation area
Support Levels
• $70–$72 — current base zone
• $65 — next major downside support
Scenarios
- Relief Rally (Primary Case) — Oversold bounce pushes price toward $79–$85 as sellers exhaust and short covering kicks in.
- Base Formation (Secondary Case) — Stock consolidates between $70–$80, building a range before the next directional move.
- Bearish Continuation (Risk Case) — Breakdown below $70 opens the door toward $65 if broader market weakness persists.
Conclusion: Oversold, Not Broken — Watch for a Bounce
Abercrombie & Fitch remains in a broader downtrend, but the current technical setup is shifting toward a potential short-term opportunity. Deeply oversold momentum, stabilizing price action, and fading selling pressure suggest that a relief rally could be near.
While the longer-term trend has yet to turn, this is the kind of setup where risk/reward begins to favor tactical bulls — particularly if price can reclaim the $80 level and confirm a shift in momentum.
_05_29_2026_12_51_29_343999.png)

_05_22_2026_13_43_24_094033.jpg)


 Please wait processing your request...