
Key Momentum Drivers
- The Growth Rebound: XLC and XLK have successfully reclaimed the Leading quadrant, suggesting that institutional capital is rotating back into mega-cap growth as a sanctuary despite broader yield volatility.
- Energy Profit-Taking: After a period of dominance, Energy (XLE) has moved into the Weakening quadrant, indicating that the initial "geopolitical shock" is being digested by the market.
- Defensive Fragility: Traditionally safe sectors like Utilities (XLU) and Consumer Staples (XLP) continue to struggle, with investors preferring cash or high-conviction growth over these yield-sensitive proxies.
Based on the Relative Performance Visualization for the US market as of March 16, 2026, the market is experiencing a significant divergence between growth-oriented leadership and defensive exhaustion.
US Sector Relative Momentum Chart
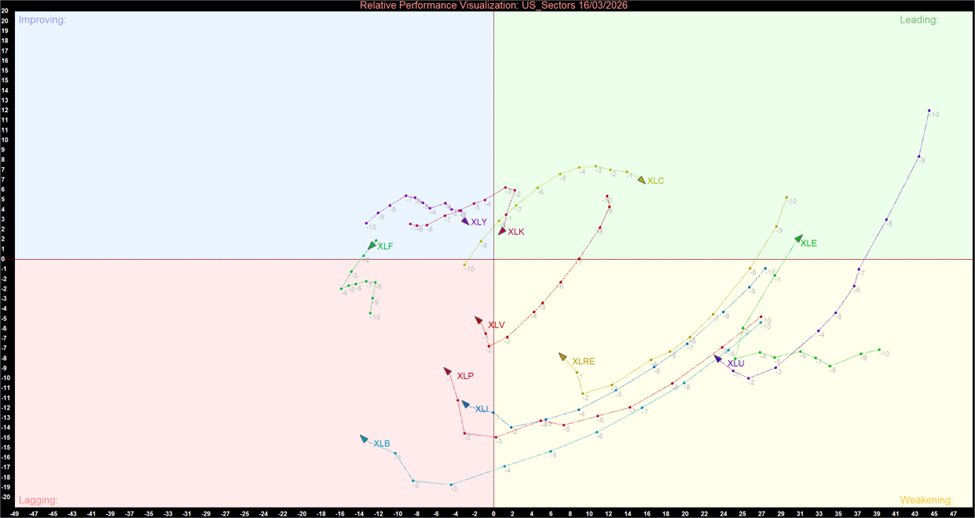
US Sector Relative Momentum Chart (at the closing price of 16th March 2026). Powered by: amibroker.com
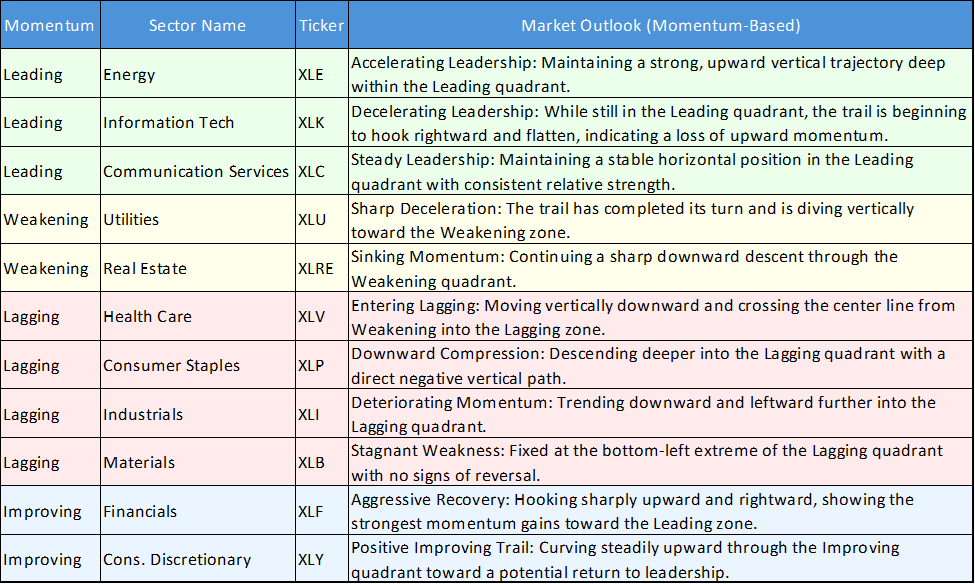
US Sector Momentum Summary Table
Dominant Leadership: Growth & Energy Resilience
- Energy (XLE): Positioned deep in the Leading quadrant, Energy remains a primary market frontrunner. Its trajectory shows strong relative strength as it continues to benefit from the geopolitical "risk premium" associated with supply threats in the Strait of Hormuz.
- Communication Services (XLC): Remains a primary leader with high relative strength and positive vertical momentum. Mega-cap stability continues to attract institutional capital as a sanctuary from broader market volatility.
- Information Technology (XLK): While firmly in the Leading quadrant, the momentum trail for Tech is beginning to flatten horizontally. This suggests that while relative strength remains high due to AI backlogs, its upward momentum intensity is decelerating as yields remain elevated.
The Defensive Pivot: Weakening Momentum
- Utilities (XLU) & Real Estate (XLRE): These sectors are currently in the Weakening quadrant and are descending vertically toward the Lagging zone. As "bond proxies," they are seeing a sharp erosion in relative strength as the 10-year Treasury yield continues its ascent.
The Recovery Phase: Improving Financials
- Financials (XLF): Located in the Improving quadrant, Financials exhibit one of the most aggressive upward "hooks" on the chart. The momentum trail is pointing directly toward the Leading zone as markets price in a higher probability of sustained interest rates, which supports banking margins.
Intense Lagging: Cyclical Struggles
- Materials (XLB) & Industrials (XLI): These sectors are stuck deep in the Lagging quadrant with an intense downward momentum curve. Despite signs of bottoming in other markets, they have not yet gained the relative strength required to exit the Lagging zone.
- Consumer Staples (XLP): Moving vertically downward within the Lagging quadrant. Investors are largely bypassing traditional defensive names in favor of hard commodities or cash.
- Health Care (XLV): Crossing the midline from Weakening directly into the Lagging quadrant with a sharp downward angle. This intense loss of momentum indicates a rapid exit by institutional investors seeking higher-alpha sectors like Energy
Bottom Line
The current US market landscape is defined by a sharp divergence between AI-driven growth and interest-rate-sensitive defensives. While rising Treasury yields pose a significant "duration risk" to broader indices, institutional capital is finding sanctuary in the mega-cap stability of Communication Services (XLC) and the massive backlogs within Information Technology (XLK). Concurrently, the persistent geopolitical "risk premium" continues to provide a tailwind for Energy (XLE), which is signaling a return to leadership despite recent profit-taking. Conversely, Real Estate (XLRE) and Utilities (XLU) remain vulnerable "bond proxies" as long as yields continue their ascent.
_06_12_2026_23_00_13_327450.jpg)


 Please wait processing your request...