
 CA
 NZ
 UK
 AU
 IND

 US

 Share
 X (Formerly Twitter)
 Whatsapp
 Facebook
 LinkedIn
 Telegram
 Email This Article
 Copy Link
 Summarize with AI
 Chat GPT
 Perplexity

Key Momentum Shifts
- Energy (XLE) occupies the Leading quadrant and is positioned furthest to the right, indicating strong relative momentum.
- Consumer Staples (XLP), Consumer Discretionary (XLY), Healthcare (XLV) and Utilities (XLU) also sit in Leading.
- Financials (XLF), Real Estate (XLRE), Materials (XLB), Communication Services (XLC) and Industrials (XLI) are grouped in Improving.
- Technology (XLK) remains the only sector in Lagging and is positioned substantially below the horizontal midpoint.
- No sector is currently positioned in Weakening, while Leadership is broader than a configuration dominated by only one or two sectors.
- The chart shows a clear split between sectors with positive relative momentum and Technology, whose position remains materially weaker.
The latest Relative Performance Visualization for 20 October 2026 shows a broad group of five US sectors in the Leading quadrant and another five in Improving. Energy, Consumer Staples, Consumer Discretionary, Healthcare and Utilities occupy Leading, while Financials, Real Estate, Materials, Communication Services and Industrials are positioned in Improving. Technology is the sole sector in Lagging, and no sector is located in Weakening.
This configuration indicates that relative momentum is positive across much of the market, although leadership is uneven. Energy has the strongest rightward position on the chart, while Healthcare and Utilities also occupy the Leading quadrant. Technology stands apart from the other sectors because its position remains deep in the lower-left area, indicating substantially weaker relative momentum.
Momentum Breakdown by Sector
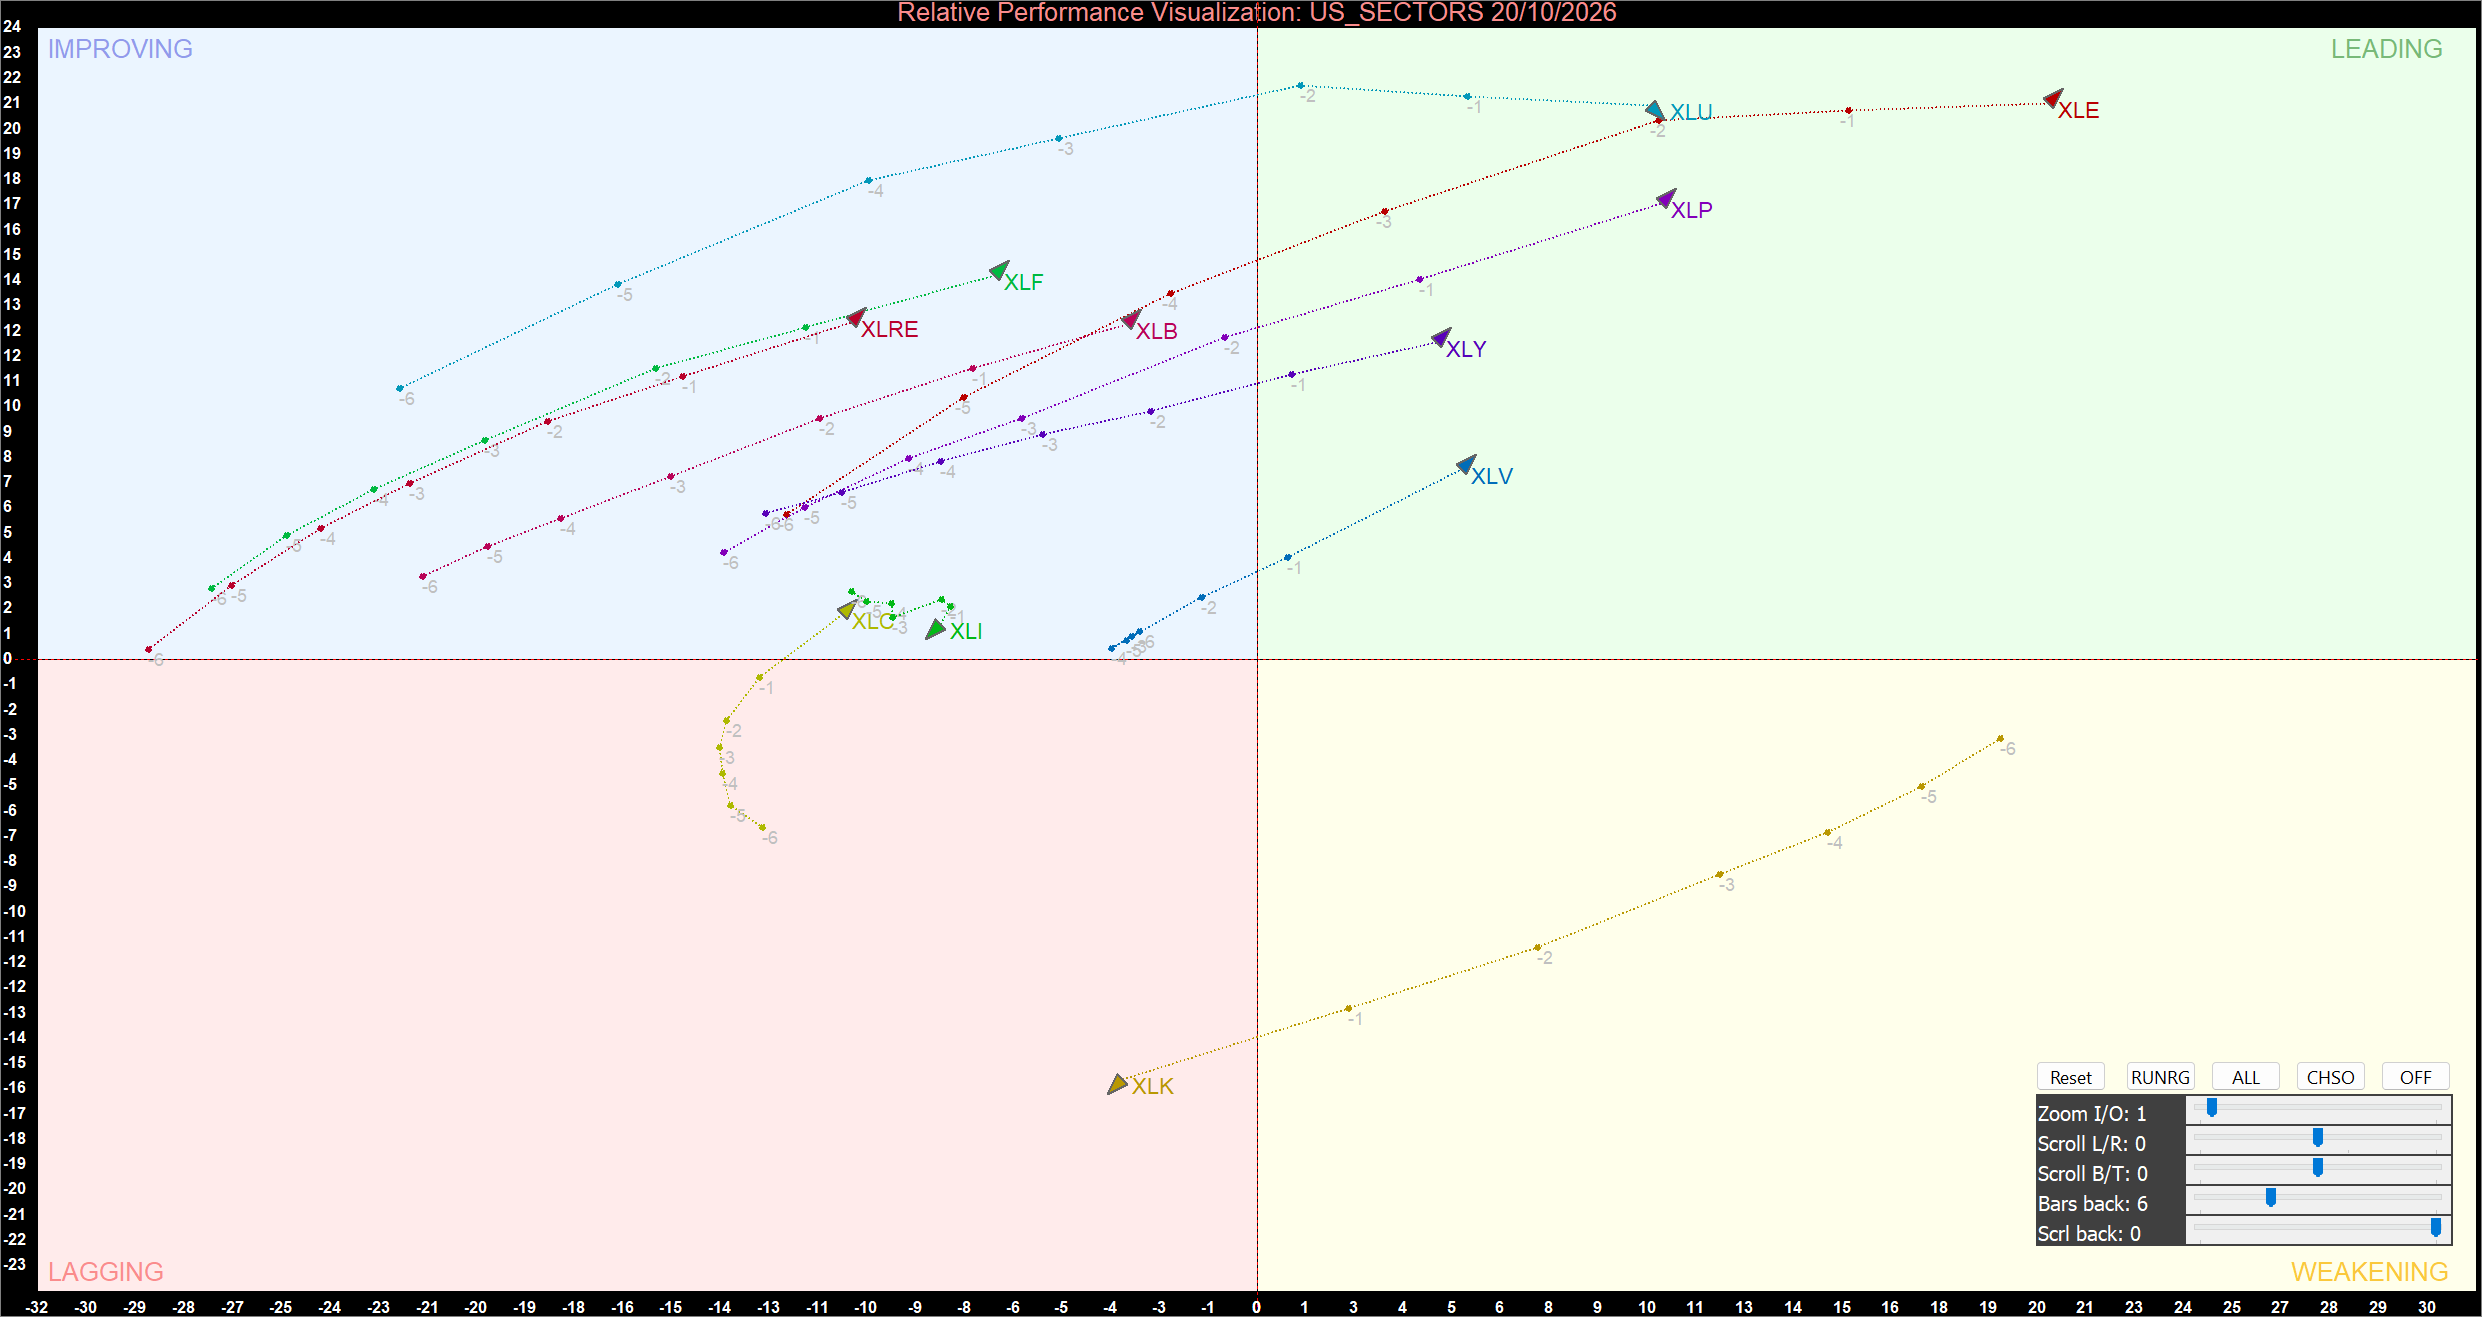
US Sector Relative Momentum Chart (at the closing price of 20/10/2026). Powered by: amibroker.com.
Leading Quadrant
Energy (XLE), Consumer Staples (XLP), Consumer Discretionary (XLY), Healthcare (XLV) and Utilities (XLU) are positioned in the Leading quadrant. Their location to the right of the vertical midpoint and above the horizontal axis indicates relatively strong momentum and relative strength. Energy is the most rightward of the group, placing it among the clearest leaders on the current chart.
Consumer Staples and Consumer Discretionary are also positioned well inside Leading, while Utilities and Healthcare remain in the upper-right quadrant. Their Placement suggests that leadership extends across defensive and consumer-related areas as well as Energy. However, quadrant membership alone does not guarantee that momentum will continue to strengthen. The recent trajectory of each sector remains relevant, particularly if a line begins to turn back toward the centre of the chart.
Improving Quadrant
Financials (XLF), Real Estate (XLRE), Materials (XLB), Communication Services (XLC) and Industrials (XLI) occupy Improving. These sectors remain on the left side of the vertical axis but above the horizontal midpoint, indicating that their relative momentum is improving even though their overall relative position has not yet reached Leading.
Financials and Real Estate are positioned comparatively high within this quadrant, while Materials is closer to the boundary with Leading. Communication Services and Industrials sit nearer the horizontal axis, suggesting a more modest positive momentum position. Materials, in particular, is closer to the central boundary than several of its peers; continued movement to the right would provide stronger evidence of a transition into Leading. For the other Improving sectors, sustained upward and rightward movement would be needed to confirm that their relative momentum is strengthening consistently.
Technology Remains in Lagging
Technology (XLK) is the only sector in the Lagging quadrant. Its marker sits well below the horizontal axis and to the left of the vertical midpoint, making it the clearest outlier in the current sector configuration. This position indicates weak relative momentum compared with the broader market and contrasts sharply with the five sectors occupying Leading.
XLK’s trajectory has moved upward from a more deeply negative position, but it remains far below the horizontal midpoint. That path may indicate an early attempt to recover, yet the sector has not crossed into Improving. A sustained move upward toward the centre and then above the horizontal axis would be required to signal a meaningful improvement in its quadrant status. Until then, Technology remains the weakest relative-momentum area on the chart.
Strategic Summary
The 20 October 2026 chart presents a broadly constructive relative-momentum structure, with five sectors in Leading and five in Improving. Energy is the most prominent leader by its rightward position, supported by Consumer Staples, Consumer Discretionary, Healthcare and Utilities. Financials, Real Estate, Materials, Communication Services and Industrials form a substantial Improving group, suggesting that positive momentum is not confined to a narrow set of sectors.
Technology is the principal exception, remaining deep in Lagging despite an upward trajectory toward the centre of the chart. The next important signal will be whether the Improving sectors continue moving rightward into Leading and whether Technology can make a sustained recovery toward the horizontal midpoint. Overall, momentum breadth is relatively strong, but the divergence between the upper quadrants and Technology remains the defining feature of the current chart.

 Oct 28, 2026





 Please wait processing your request...