
Key Momentum Highlights
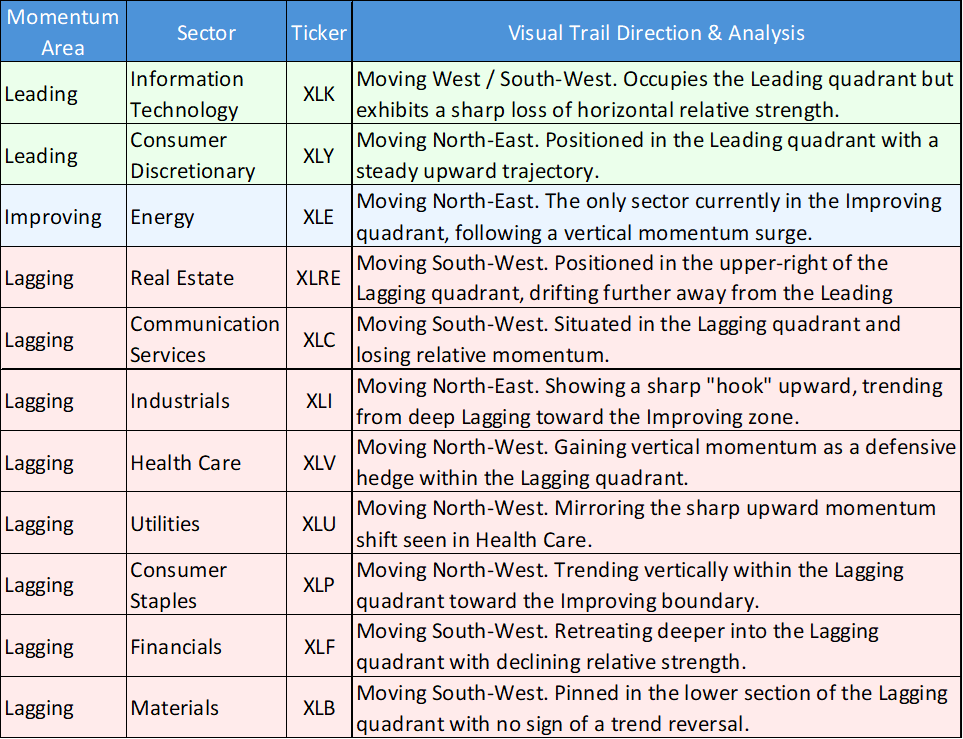
- Momentum Leader: Energy (XLE) is the sole occupant of the Improving quadrant, displaying the sharpest vertical momentum and a North-East trajectory.
- Leading Quadrant Divergence: Information Technology (XLK) remains in the Leading quadrant but exhibits a sharp South-West directional curl, indicating a rapid contraction in relative momentum. Consumer Discretionary (XLY) maintains a North-East trajectory within the Leading space.
- Lagging Quadrant Bifurcation: The Lagging quadrant is heavily populated but split into two distinct trajectory groups. Defensives (XLU, XLV, XLP) and Industrials (XLI) are printing sharp upward hooks (North-West/North-East), while Real Estate (XLRE), Communication Services (XLC), Financials (XLF), and Materials (XLB) continue to drift South-West.
The US Equity market session on April 30, 2026, was characterized by an underlying momentum rotation that contrasts with the broad-based absolute performance gains. Relative performance visualization data indicates a structural shift, with historical leaders shedding relative strength while deeply lagging sectors exhibit sharp upward momentum reversals.
Sector Momentum and Trajectory Summary
The following chart and table detail the momentum quadrant positioning and visual trail vectors for the 11 major US S&P 500 sectors:

US Sector Relative Momentum Chart (at the closing price of 30/04/2026). Powered by: amibroker.com
Quantitative Momentum Themes
XLK Relative Strength Contraction
While Information Technology (XLK) remains the statistical leader on the relative rotation graph, its vector has turned sharply West/South-West. This trajectory confirms a deceleration in momentum relative to the benchmark. This directional change contrasts with the absolute performance data (+0.25%), highlighting a quantitative rotation out of the sector despite positive daily returns.
The Energy Breakout Vector
Energy (XLE) displays the most aggressive momentum shift on the chart. Its transition into the Improving quadrant is supported by a steep, vertical North-East vector. This establishes XLE as the primary momentum outlier, decoupling from the broader Commodity and cyclical complex, which remains depressed in the Lagging zone.
Divergent Trajectories in the Lagging Quadrant
The Lagging quadrant contains nine of the eleven sectors, but the data reveals two opposing momentum profiles:
- Positive Momentum Hooks: XLI (+2.74% absolute), XLU (+2.56%), XLV (+2.21%), and XLP (+1.68%) are all printing aggressive North-West or North-East vectors. This statistical clustering indicates a concentrated accumulation phase and a sharp increase in relative momentum for these specific defensive and cyclical Assets.
- Continued Relative Degradation: XLRE, XLC, XLF, and XLB all exhibit South-West vectors. Despite positive absolute performance on the day, these sectors are systematically losing relative strength and momentum, pushing them deeper into the Lagging parameters.
Data from April 30 indicates a statistically significant rotation in market leadership. Absolute performance metrics show clear outperformance in Industrials (+2.74%), Utilities (+2.56%), and Health Care (+2.21%), while Information Technology lagged the broader market (+0.25%). Concurrently, relative rotation data confirms this structural shift: Information Technology (XLK) is exhibiting a sharp South-West trajectory, indicating a rapid contraction in relative momentum, while Energy (XLE) has crossed into the Improving quadrant with a steep North-East vector. Furthermore, defensive sectors (XLU, XLV, XLP) and Industrials (XLI) are displaying aggressive upward momentum hooks from within the Lagging quadrant. Consequently, the combined metrics support a quantitative reallocation of Capital away from historical growth leaders and toward traditional value, defensive, and energy sectors.


 Please wait processing your request...