_03_18_2026_03_03_20_602013.jpg)
Key Highlights
- Growth Rebound: Communication Services and Tech reclaimed the Leading quadrant as institutional capital sought mega-cap stability.
- Energy Resilience: Energy remains a primary market frontrunner, benefiting from geopolitical risk premiums in the Strait of Hormuz.
- Financials Improving: Financials show an aggressive upward momentum "hook" as markets price in sustained higher interest rates.
- Defensive Exhaustion: Yield-sensitive sectors like Utilities and Real Estate are fading as rising Treasury yields erode their relative strength.
The US equity market is currently defined by a stark divergence between AI-driven growth and interest-rate-sensitive defensives. While rising Treasury yields pose a significant "duration risk" to broader indices, institutional capital is finding sanctuary in the mega-cap stability of Communication Services (XLC) and the massive backlogs within Information Technology (XLK).
Daily US Sector Relative Momentum Chart – 17/03/2026
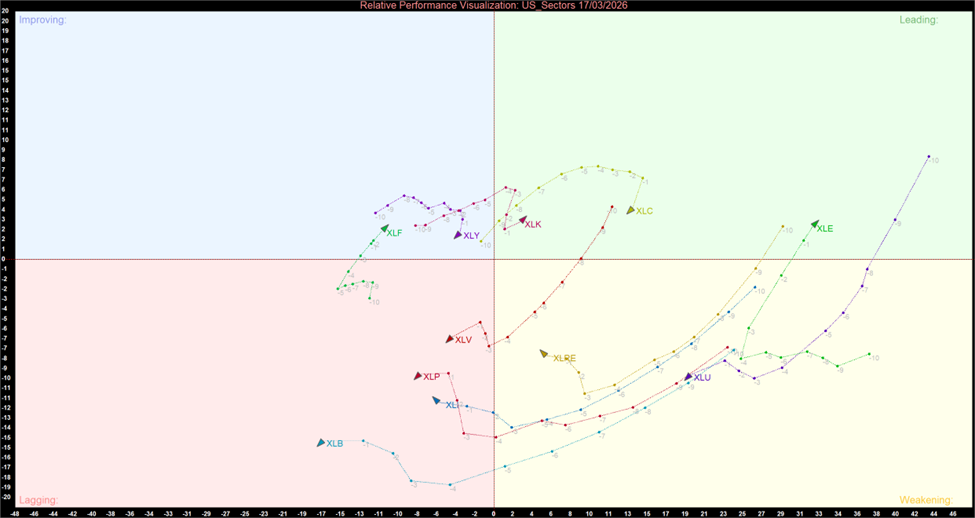
US Sector Relative Momentum Chart (at the closing price of 17th March 2026). Powered by: amibroker.com
Daily US Sector Momentum Summary Table
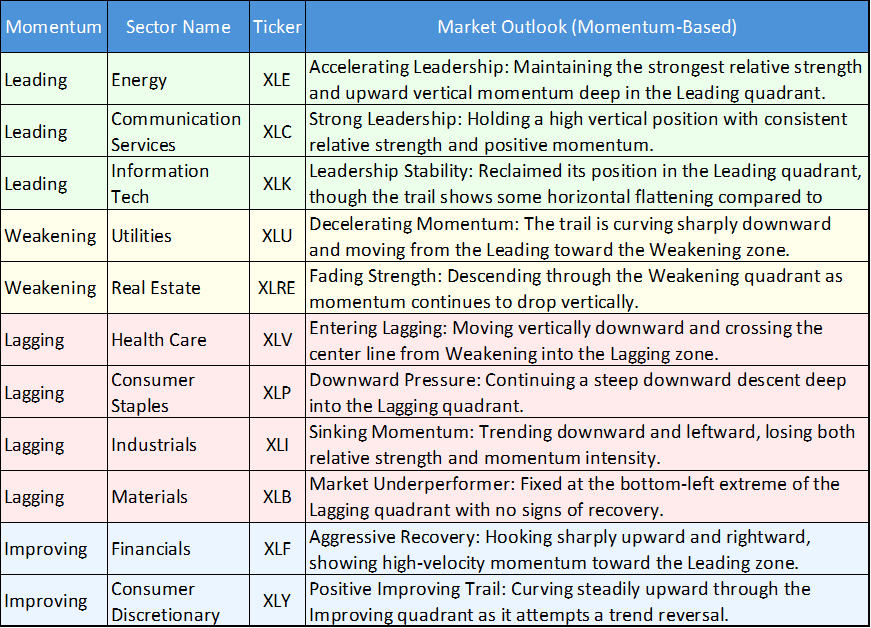
Dominant Leadership: Growth & Energy Resilience
The current leadership profile is anchored by a mix of high-conviction growth and geopolitical inflation hedges:
- Energy (XLE): Positioned deep in the Leading quadrant, Energy remains a primary market frontrunner. Its trajectory shows strong relative strength as it continues to benefit from the geopolitical "risk premium" associated with supply threats in the Strait of Hormuz.
- Communication Services (XLC): This sector remains a primary leader, maintaining high relative strength and positive vertical momentum. Its blue-chip stability continues to attract institutional capital as a sanctuary from broader market volatility.
- Information Technology (XLK): While firmly in the Leading quadrant, the momentum trail for Tech is beginning to flatten horizontally. This suggests that while relative strength remains high due to AI backlogs, its upward momentum intensity is decelerating as yields remain elevated.
The Recovery Phase: Improving Financials
- A notable shift is occurring in the Improving quadrant, where Financials (XLF) exhibit one of the most aggressive upward "hooks" on the chart. The momentum trail is pointing directly toward the Leading zone as markets price in a higher probability of sustained rates, which supports banking margins. Concurrently, Consumer Discretionary (XLY) is attempting a recovery trail, curving steadily upward as it tries to bottom out after a period of intense selling pressure.
Defensive Fragility and Intense Lagging
The "bond proxy" sectors are currently facing a period of structural liquidation:
- Weakening Defensives: Utilities (XLU) and Real Estate (XLRE) are descending vertically toward the Lagging zone. As yields creep higher, these sectors are seeing a sharp erosion in relative strength, regardless of their defensive nature.
- Intense Lagging: Health Care (XLV) and Consumer Staples (XLP) are experiencing an intense loss of momentum. XLV recently crossed the midline from Weakening directly into the Lagging quadrant, indicating a rapid exit by investors seeking higher-alpha plays.
- Cyclical Struggles: Materials (XLB) and Industrials (XLI) remain stuck deep in the Lagging quadrant with intense downward momentum curves, struggling with rising operating expenses and a "sticky" inflation backdrop.
Bottom Line
The US market has entered a tactical recovery phase as immediate "oil shocks" begin to recede. While Energy and Materials provided a floor during the peak of geopolitical conflict, the cooling of yields has reignited the structural bull market in Tech and Communication Services. However, investors must remain cautious of Real Estate (XLRE) and Utilities (XLU), which remain vulnerable as long as Treasury yields continue their ascent.
_06_12_2026_23_00_13_327450.jpg)


 Please wait processing your request...