
Key Highlights
- Defensive Leadership: Utilities (XLU) and Consumer Staples (XLP) have surged into the Leading quadrant, signaling a sharp rotation into safety.
- Energy Resilience: Energy (XLE) remains a dominant force, maintaining its position as a top-tier relative strength leader.
- Tech Under Pressure: Information Technology (XLK) is losing vertical momentum, drifting from Leading toward the Weakening quadrant.
- Cyclical Struggles: Real Estate (XLRE) and Financials (XLF) continue to languish in the Lagging zone with downward-pointing trajectories.
The US equity market on March 18, 2026, is witnessing a significant structural shift. As volatility increases, the "risk-on" appetite that previously fueled Technology and Discretionary sectors is being replaced by a defensive crouch. The Relative Rotation Graph highlights a market that is increasingly prioritizing capital preservation over aggressive growth.
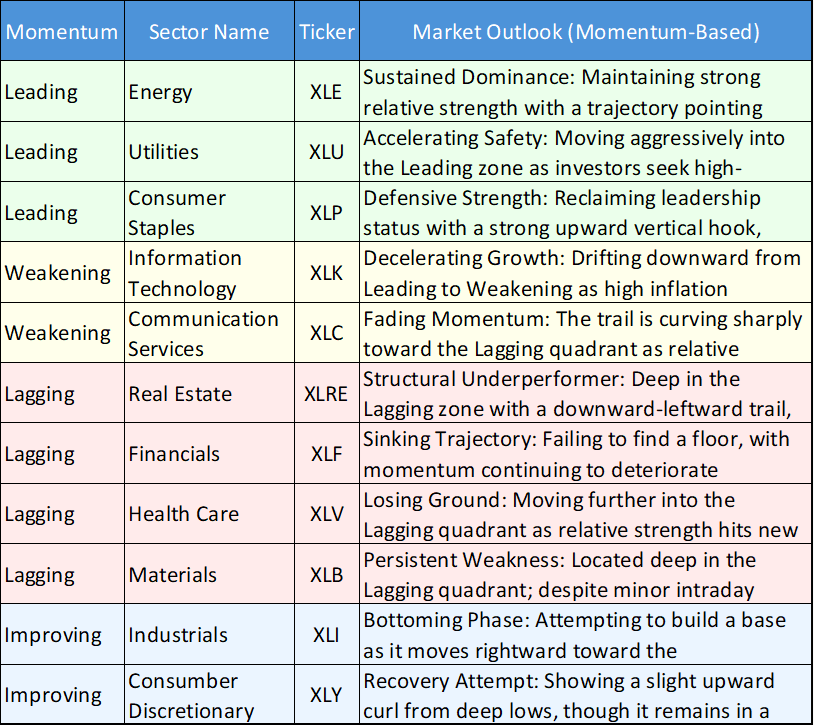
US Sector Momentum Summary
The following table summarizes the trajectory of major sectors based on their current quadrant positioning and trail movement:
Daily US Sector Relative Momentum Chart – 18/03/2026
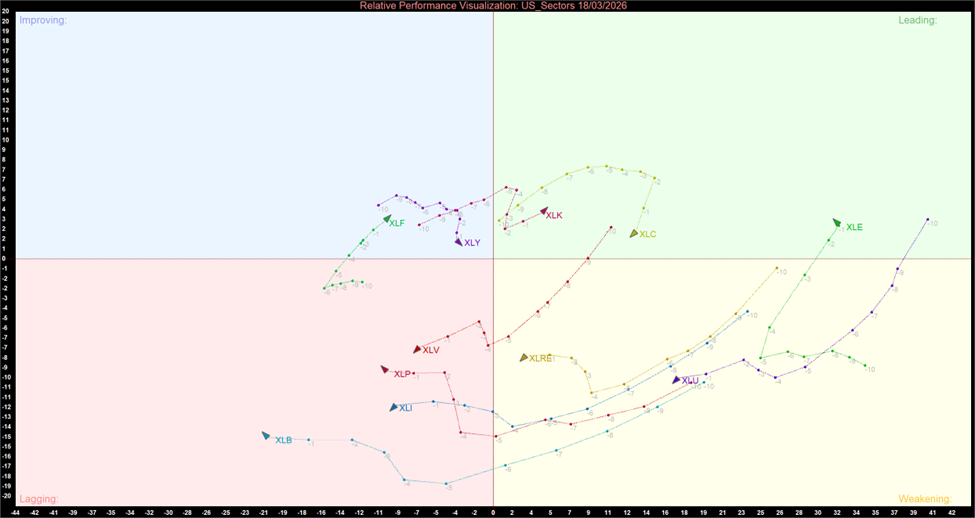
US Sector Relative Momentum Chart (at the closing price of 18th March 2026). Powered by: amibroker.com
Daily US Sector Momentum Summary Table
Leading Momentum: The Performance Drivers
Sectors here have strong relative strength and positive momentum.
- Energy (XLE): Remaining deep in the Leading quadrant, Energy is the standout performer. Its trail is pointing further into the upper-right, indicating that its outperformance is not just stable but accelerating.
- Utilities (XLU) & Consumer Staples (XLP): These defensive sectors have made a powerful move from the Improving quadrant into Leading. This suggests a "flight to safety" where investors are prioritizing dividends and stability over growth.
Weakening Momentum: The Fading Leaders
Sectors here still have high relative strength, but their momentum is slowing down.
- Information Technology (XLK): While still technically a leader in terms of absolute price, the RRG shows its momentum is "hooking" downward. This implies that while it outperformed recently, it is now losing steam relative to the broader market.
- Communication Services (XLC): This sector is following a similar path to Tech, with its trail moving vertically downward toward the Lagging quadrant, signaling a cooling-off period for mega-cap growth.
Lagging Momentum: The Underperformers
Sectors here have poor relative strength and negative momentum.
- Real Estate (XLRE) & Financials (XLF): These interest-rate-sensitive sectors are the weakest on the chart. Their trails are moving deeper into the bottom-left, indicating a period of structural underperformance likely driven by high yields.
- Health Care (XLV) & Materials (XLB): These remain firmly entrenched in the Lagging zone. Health Care, in particular, shows a sharp downward trajectory, suggesting institutional capital is rotating elsewhere.
Improving Momentum: The Potential Rebounders
Sectors here have poor relative strength but are gaining positive momentum.
- Industrials (XLI): This is the most interesting sector in this quadrant. Its trail is moving sharply to the right toward the Leading zone. This "rotation" often precedes a period of outperformance, suggesting Industrials are bottoming out.
- Consumer Discretionary (XLY): While still exhibiting low relative strength, it is curving upward. This indicates that while the sector is still struggling, the rate of its decline has stopped, and a recovery phase is attempting to begin.
Summary of Sentiment
The chart depicts a Defensive Rotation. The aggressive moves by XLU and XLP into the Leading quadrant, coupled with the weakening of XLK and XLC, suggest that market participants are shifting toward a "Risk-Off" posture. Energy remains the only "Risk-On" cyclical sector maintaining absolute leadership.
_06_12_2026_23_00_13_327450.jpg)


 Please wait processing your request...