
Key Highlights
- The Great Rotation Right: A massive, synchronized shift is occurring across the board. Seven sectors have hooked sharply North-East, signaling a profound expansion in market breadth and true relative strength against the S&P 500.
- Energy Breaks Down: Energy (XLE) has officially hooked South-West. It is actively losing both vertical momentum and horizontal relative strength, confirming the unwinding of its extreme benchmark distortion.
- Tech Rebounds: Information Technology (XLK) is finally catching a real bid, hooking aggressively rightward to gain both momentum and relative strength after a prolonged structural slide.
- Real Estate Explodes: Exhibiting one of the sharpest upward trajectories on the chart, Real Estate (XLRE) is surging North-East from the depths of the Lagging quadrant, fueled by a heavy rotation into yield.
The US sector rotation on April 2, 2026, reveals a market undergoing a massive, synchronized structural transition. As the momentum chart illustrates, the mathematical distortion previously caused by the Energy sector's extreme, singular outperformance is rapidly unwinding. This critical breakdown in the commodity space is finally allowing the broader market to breathe, resulting in a dramatic expansion of market breadth as capital aggressively rotates into cyclicals, defensives, and beaten-down technology names.
Daily US Sector Momentum Summary – 02/04/2026
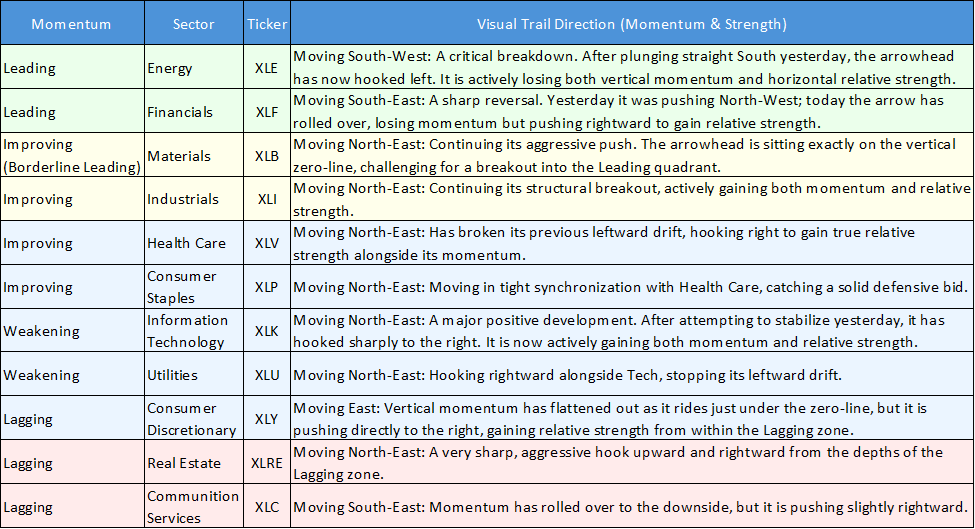
The following table categorizes all 11 sectors into their confirmed momentum areas based on their precise visual trajectories:
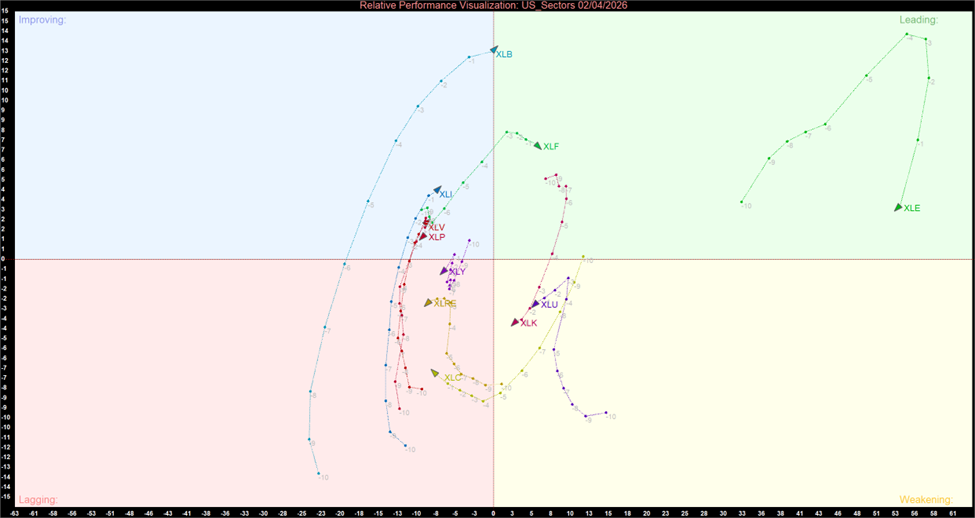
US Sector Relative Momentum Chart (at the closing price of 02nd April 2026). Powered by: amibroker.com
Daily US Sector Momentum Summary Table
Key Market Themes
The Great Rotation Right
The most profound visual change on this chart is the synchronized rightward hook. Just two sessions ago, nearly the entire market was drifting strictly North-West—gaining momentum but bleeding relative strength to the benchmark. Today, that narrative has completely flipped. Almost the entire left side of the chart (XLB, XLI, XLV, XLP, XLRE, XLK, XLU) has hooked North-East. This signals that the broader market is finally gaining true relative strength against the S&P 500, marking a dramatic and healthy expansion in overall market breadth.
Energy's Relative Strength Cracks
The primary catalyst allowing the rest of the market to surge rightward is the structural breakdown of Energy (XLE). XLE's trajectory has shifted violently to the South-West. For weeks, the inflation-hedge trade hoarded capital and mathematically distorted the S&P 500 average. That distortion is now unwinding rapidly as institutional investors aggressively take profits and redistribute that liquidity back into the broader economy.
Tech and Real Estate Catch a Real Bid
Beneath the surface of the broad market rotation, two distinct themes are playing out: defending growth and hunting for yield.
- Information Technology (XLK) is no longer just dead-cat bouncing; its sharp North-East trajectory indicates that buyers are accumulating tech shares with enough conviction to structurally improve its relative strength.
- Simultaneously, Real Estate (XLRE) is exhibiting one of the sharpest upward arrowheads on the board. This violent North-East hook from the depths of the Lagging quadrant confirms a massive influx of capital into rate-sensitive, dividend-paying assets.
Bottom Line
The momentum landscape on April 2 confirms a much healthier, highly diversified US equity market. The extreme concentration risk tied to the Energy sector is actively unwinding. Investors are no longer hiding in a single commodity trade; instead, they are deploying capital across a wide spectrum of opportunities, from defensive yield in Real Estate to cyclical expansion in Industrials and secular growth in Technology. This broadening participation provides a much more stable foundation for the major indices moving forward.


 Please wait processing your request...