
US equity markets faced a sharp reversal today, Thursday, March 12, 2026, as a dramatic surge in global oil prices reignited inflation fears and sent interest rate expectations soaring. The S&P 500 plummeted 1.5%, effectively erasing the gains of the previous two sessions and returning to the "big swings" that have defined the volatile start to the year.
The narrative of the day was dominated by a single outlier: Energy, which stood as one of the few sectors to resist a broad market meltdown. Breadth was notably weak across the major indices; the Dow Jones Industrial Average tumbled 1.6% (roughly 739 points), and the tech-heavy Nasdaq Composite sank 1.8%.
Sector Performance Heatmap
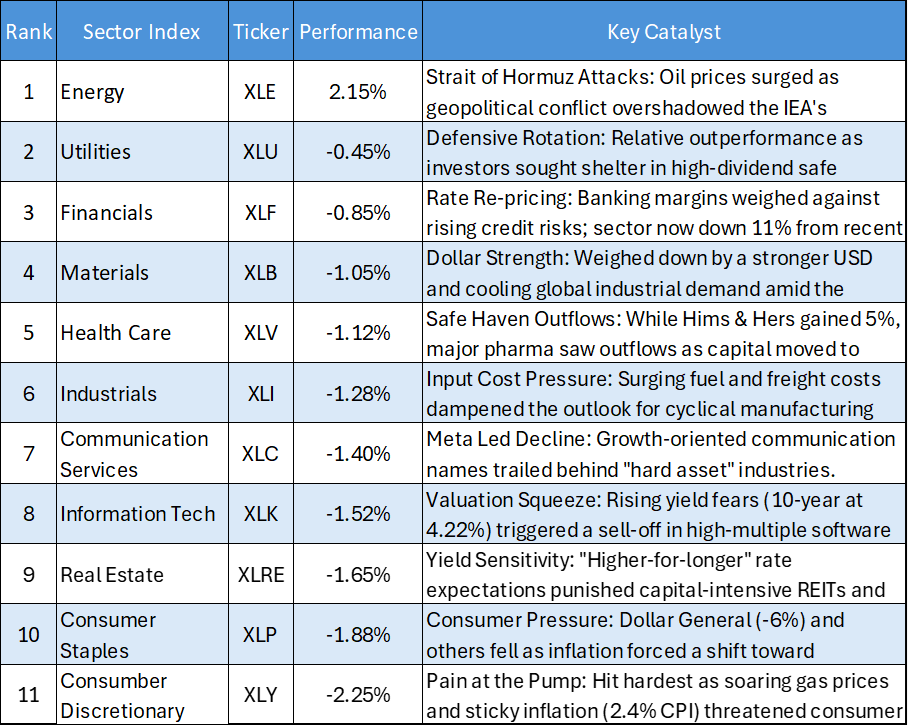
Energy: The Geopolitical Hedge
While the International Energy Agency (IEA) attempted to calm markets by announcing a record release of 400 million barrels from strategic reserves, the move was largely dismissed as a temporary fix. Supply risks remain at the forefront as conflict with Iran threatens the Strait of Hormuz, a key route for global oil shipments.
- Brent Crude: Reached highs of $101.59 per barrel as worries worsened regarding long-term production blocks in the Persian Gulf.
- Exxon Mobil (XOM): Positioned as a primary leveraged play for surging commodity prices following its strong end-of-2025 earnings.
- Chevron (CVX) & Marathon Petroleum (MPC): Remained in focus as top energy players benefiting from the "late-cycle" surge in crude.
Technology: The Yield Victim
With the US 10-year Treasury yield climbing to 4.26%—a five-week high—sectors relying on high growth were severely punished.
- Software Meltdown: Software companies bore the brunt of the selloff, with investors increasingly skeptical about growth sustainability amid AI-driven disruption.
- Big Tech: Despite recent resilience, high-growth names faced downward pressure as rising yields reduced the present value of future cash flows.
- Oracle (ORCL): Remained a rare bright spot earlier in the week due to AI cloud demand, but struggled to lift the broader sector against the weight of rising rates.
Financials: Bracing for the Fed
The narrative for the financial sector shifted violently today as traders pushed back forecasts for when the Federal Reserve might resume interest rate cuts.
- Hawkish Tilt: Minutes from recent Fed meetings and surging oil prices have reignited a "hawkish" bias, with some officials now indicating that rate hikes could be appropriate if inflation remains sticky near 3%.
- Private Credit Jitters: The S&P 500 financials index dropped 1.5% as mounting jitters in the $2 trillion private credit market added to interest rate anxieties.
- Morgan Stanley: Shares tumbled 3% after the firm limited redemptions at one of its private income funds, sparking widespread concern over institutional liquidity.
US Sector Year-to-date Risk and Yield Mapping
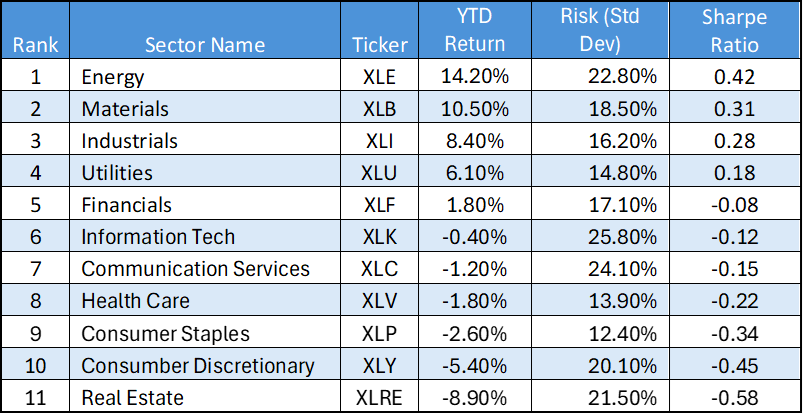
The Alpha Leaders: "Real Assets" Domination
- Energy (XLE): Positioned as the undisputed market leader with a 14.20% YTD return. Despite its high volatility (22.80% Std Dev), it maintains the highest Sharpe Ratio (0.42) in the market, suggesting that the "geopolitical premium" from the Strait of Hormuz conflict is providing genuine risk-adjusted outperformance.
- Materials (XLB) & Industrials (XLI): These sectors follow closely, delivering high single-to-double-digit returns. Their positive Sharpe Ratios (0.31 and 0.28, respectively) indicate a broad structural rotation into the "real economy" as investors flee interest-rate-sensitive "paper" assets.
The High-Beta Trap: Information Technology (XLK)
- High Risk, Low Reward: The Tech sector exhibits a classic "high-risk" profile with the highest standard deviation in the market at 25.80%.
- Negative Sharpe Ratio: With a YTD return of -0.40% and a Sharpe Ratio of -0.12, investors are currently not being compensated for the significant price swings they are enduring. The "valuation squeeze" is being driven by the 10-year Treasury yield creeping toward critical levels, punishing high-multiple growth names.
The Defensive Failure: "Yield Traps"
- Consumer Staples (XLP) & Utilities (XLU): Traditionally considered "safe havens," these sectors are failing as diversifiers in the current environment.
- Negative Returns: While Utilities managed a 6.10% return, both sectors show poor risk-adjusted profiles compared to resources, as the typical flight-to-safety trade has bypassed them in favor of cash or hard commodities.
The Danger Zone: Real Estate (XLRE)
- Structural Liquidation: Real Estate is the market's worst performer by a wide margin, posting a -8.90% YTD return.
- Highest Negative Sharpe Ratio: At -0.58, the sector reflects a structural exit as markets price in "higher-for-longer" interest rates. This is consistent with the massive pressure seen in property valuations as debt servicing costs rise.
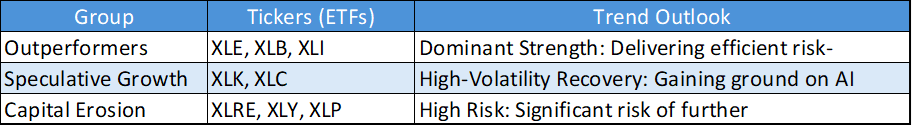
Summary Table: Risk vs. Reward
_06_12_2026_23_00_13_327450.jpg)


 Please wait processing your request...