
Image Source: Shutterstock
Long-Term Price Dynamics and Breakout
An analysis of the monthly chart for silver reveals a significant development. For years, the price of silver consolidated within a broad symmetrical wedge pattern that began after the peak in 2011. Recently, the price has broken out above the upper boundary of this pattern, indicating a potential shift from a long period of consolidation to a new, long-term upward trend. This move is supported by a series of higher highs and higher lows on the chart.
The latest monthly close for silver was approximately $44.83, a single-period advance of about 13%. This strong move has seen the price reclaim and hold above a group of key exponential moving averages (EMAs), including the 20, 50, 100, and 200-period EMAs. This alignment, with the shorter-term EMAs positioned above the longer-term ones, forms a bullish configuration that suggests a potential acceleration of the trend. The increasing size of candlesticks and the rising slope of the EMAs further supports the idea that buying pressure is currently outweighing selling pressure.
Key Price Levels and Momentum Indicators
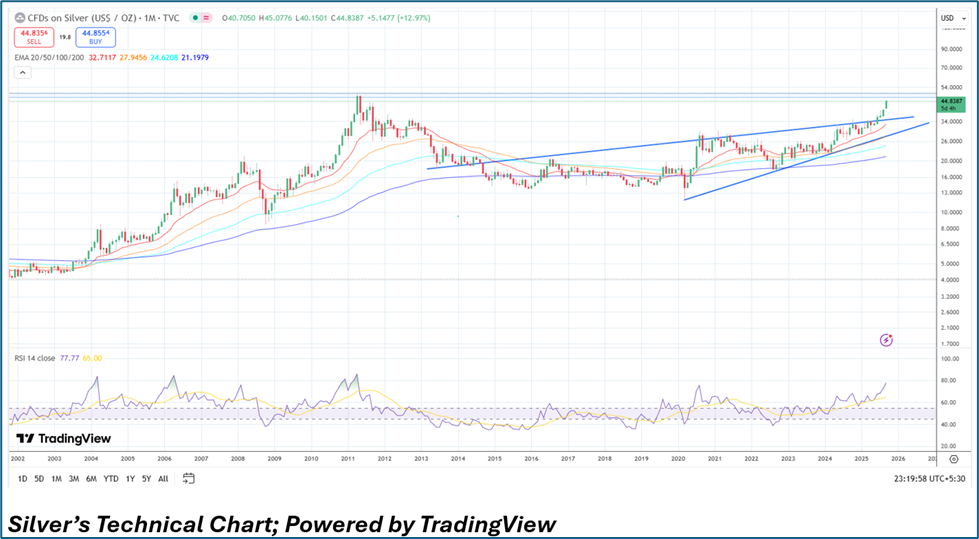
The EMAs have now established a layered support framework for silver. The 20-period EMA at $32.71 and the 50-period EMA at $27.94 are rising sharply, while the 100-period EMA at $24.62 and the 200-period EMA at $21.19 offer deeper structural support. This suggests that any potential price pullbacks might find strong support within the $27 to $32 range.
Silver is now approaching a historically important resistance zone between $45 and $50, which includes the 2011 cyclical high. A monthly close above this zone would confirm a significant long-term breakout. This could lead to a price expansion toward the $65 to $75 range, based on common technical analysis projections like Fibonacci extensions. However, if the price is unable to break through on its first attempt, a period of consolidation or a pullback toward the rising EMAs is possible, which could act as a re-entry point for market participants.
The 14-period Relative Strength Index (RSI) is currently at 77.77, which is considered overbought. In a strong trend, however, an RSI in overbought territory can often signal a strong continuation of momentum rather than an immediate reversal. A sustained period of the RSI remaining in this upper range could be interpreted as a sign of persistent bullish momentum.
However, the elevated RSI readings do increase the possibility of a short-term pullback as some traders might take profits. A retracement of the RSI toward the 60-65 zone while the price holds above the 20-period EMA would be a sign of a healthy reset in momentum without damaging the overall bullish structure.
Conclusion
Based purely on technical analysis, silver's chart exhibits a strong, constructive posture. The recent structural breakout from a multi-decade pattern, combined with the bullish alignment of the EMAs and confirming momentum from the RSI, places silver at a critical point. The market’s next major move will likely be determined by how price interacts with the $45–$50 resistance zone.
_06_12_2026_23_00_13_327450.jpg)


 Please wait processing your request...