
Highlights
- Tencent Music’s Q2 revenue rose 17.9% YoY to RMB 8,442 million, led by growth in online music and advertising.
- Profit for the period increased 37.5% YoY to RMB 2,467 million on improved margins and cost efficiency.
- Operating cash flow declined 44.4% due to working-capital timing and changes in business mix.
Tencent Music Entertainment Group (NYSE:TME) operates as a holding company overseeing a portfolio of online music and audio entertainment platforms in China. Its main activities include delivering online music streaming, social entertainment functions, and associated value-added services to users across multiple digital ecosystems.
Tencent Music reported revenue of RMB 8,442 million for the second quarter of fiscal 2025 (Q2FY25), marking a 17.9% year-on-year increase from RMB 7,160 million in Q2FY24. The rise was supported by expanding online music revenues, which grew 26.4%, alongside higher average revenue per paying user (ARPPU), a growing base of paid subscribers, improved advertising performance, and contributions from artist merchandise and offline performances. These gains were partly offset by a moderation in social entertainment revenues.
Profit for the period reached RMB 2,467 million, reflecting a 37.5% increase compared with RMB 1,794 million in the previous year. The growth was attributed to margin expansion (44.4% versus 42.0% a year earlier), efficiency gains from subscription and advertising segments, a stable cost structure relative to revenue, and a lower effective tax rate.
In Q2FY25, operating cash flow declined to RMB 1,638 million from RMB 2,944 million, a decrease of 44.4% year-on-year. The drop mainly resulted from working-capital timing effects and comparisons with a high base in the prior year, despite stronger profitability.
Cash and cash equivalents at the end of the period were RMB 10,999 million, down 10.2% from RMB 12,251 million in Q2FY24.
Upcoming Earnings Announcement
On October 14, 2025, Tencent Music Entertainment Group announced it would release its unaudited financial results for the third quarter of 2025 before U.S. market hours on November 12, 2025.
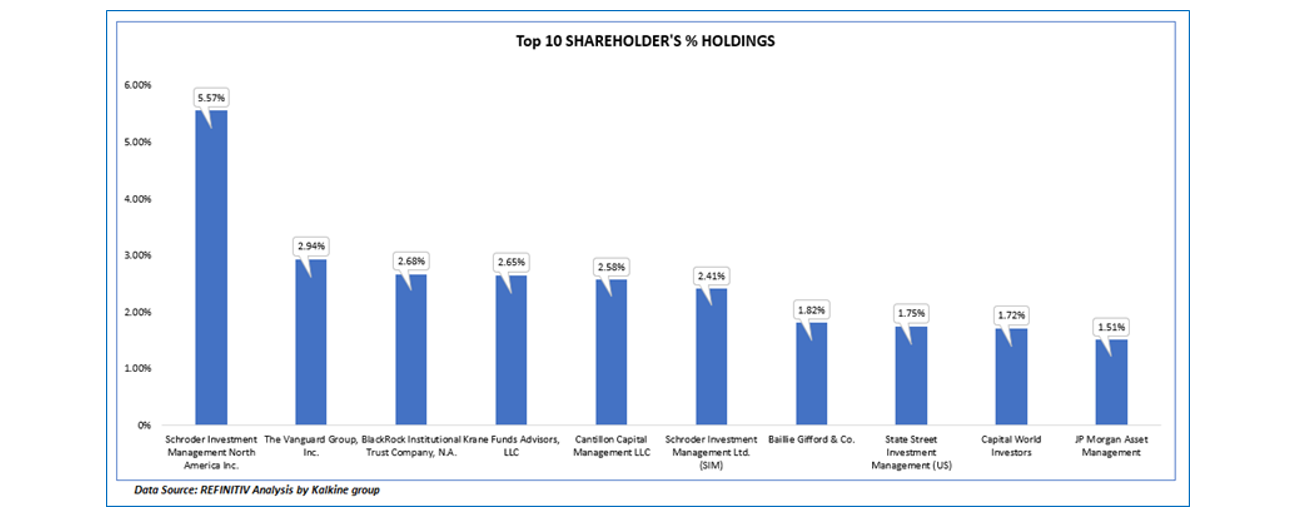
Top 10 Shareholders
The top 10 shareholders collectively hold approximately 25.62% of the company’s total shares, indicating a relatively dispersed ownership base. Schroder Investment Management North America Inc. and The Vanguard Group, Inc. are the largest shareholders, holding about 5.57% and 2.94% of the equity, respectively.
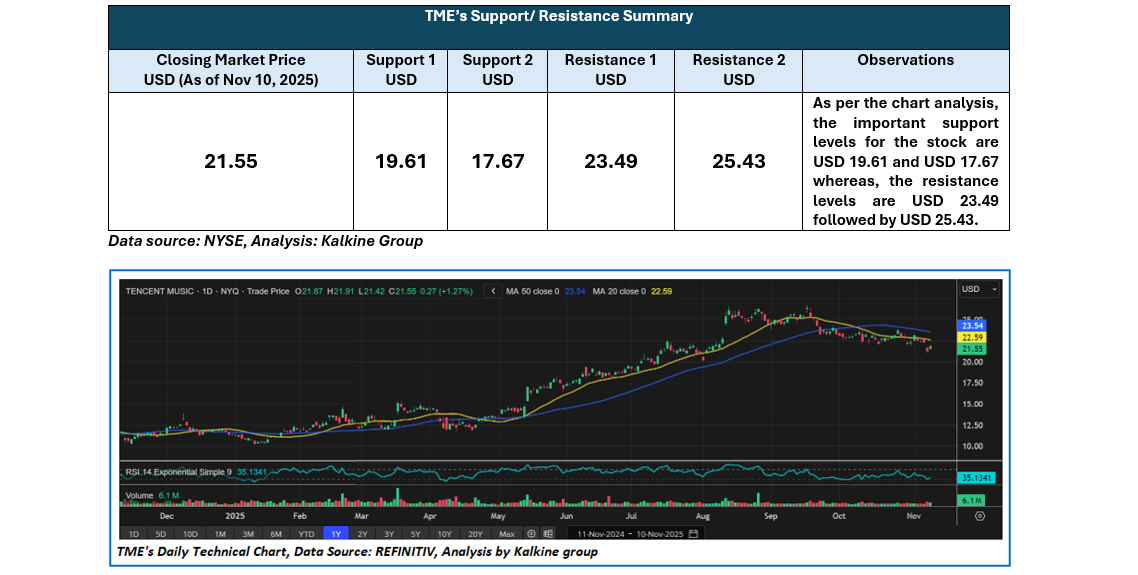
Stock Information
TME closed at USD 21.55 on November 10, 2025. Over the past six months, the stock increased by around 44%, or USD 6. The 52-week high was 26.70 USD, and the 52-week low was 10.11 USD.
 Note 1: Past performance is not a reliable indicator of future performance.
Note 2: The reference data for all price data, currency, technical indicators, support, and resistance levels is 10 Nov 2025. The reference data in this report has been partly sourced from EODHD/Others.
Technical Indicators Defined
Support: A level at which the stock prices tend to find support if they are falling, and a downtrend may take a pause backed by demand or buying interest. Support 1 refers to the nearby support level for the stock and if the price breaches the level, then Support 2 may act as the crucial support level for the stock.
Resistance: A level at which the stock prices tend to find resistance when they are rising, and an uptrend may take a pause due to profit booking or selling interest. Resistance 1 refers to the nearby resistance level for the stock and if the price surpasses the level, then Resistance 2 may act as the crucial resistance level for the stock.
_06_12_2026_23_00_13_327450.jpg)


 Please wait processing your request...