
Highlights
- JetBlue Airways (NASDAQ:JBLU) reported Q3FY25 revenue of USD 2,322 million, down 1.8% YoY
- Net loss widened to USD 143 million in Q3FY25, a 138% increase compared with prior-year quarter
- Cash and cash equivalents increased 25.5% YoY to USD 2,410 million as of Q3FY25
- CASM ex-fuel projected to rise in low single digits in 2026, supported by fleet modernization and cost discipline
- Jet Forward program expected to deliver about USD 290 million incremental EBIT by 2025, with cumulative USD 850–950 million by 2027
JetBlue Airways Corporation (NASDAQ:JBLU) operates passenger air transportation services across the United States, Canada, Latin America, the Caribbean, and select European destinations. The airline’s fleet comprises five aircraft families, including the Airbus A220, A320, A321, A321neo, and the Embraer E190.
Financial Performance
For the third quarter of the financial year 2025 (Q3FY25), JetBlue reported total operating revenue of USD 2,322.0 million, compared with USD 2,365.0 million in Q3FY24, reflecting a year-on-year decline of 1.8%. The marginal revenue contraction was primarily driven by continued domestic fare pressure and capacity adjustments, partially offset by improved ancillary revenue initiatives.
Net loss for the quarter widened to USD 143.0 million in Q3FY25, compared with a net loss of USD 60.0 million in the corresponding prior-year quarter, representing a 138.3% increase in losses. The deterioration in net income was largely attributed to elevated fuel costs, higher operating expenses, and weaker unit revenues, despite ongoing cost-control measures.
Cash flow from operating activities turned negative at USD (143.0) million in Q3FY25, compared with a positive USD 161.0 million in the prior-year period. The decline in operating cash flow reflected sustained operating losses, increased working capital requirements, and cost inflation relative to the previous year.
As of the end of Q3FY25, JetBlue reported cash and cash equivalents of USD 2,410.0 million, up from USD 1,921.0 million in Q3FY24, marking a 25.5% year-on-year increase. The improvement in liquidity was supported by proactive liquidity-preservation measures, including financing activities and balance-sheet strengthening initiatives.
Company Outlook
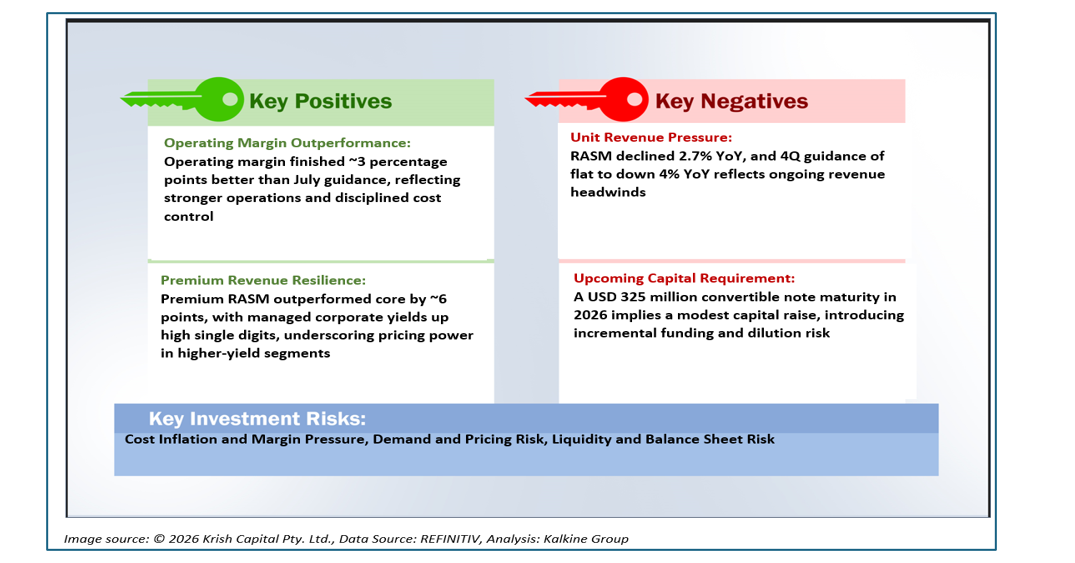
JetBlue expects Q4 2025-unit revenues (RASM) to be flat to down 4% year-over-year due to limited capacity growth and near-term challenges. In 2026, unit costs excluding fuel (CASM ex-fuel) are projected to rise in the low single digits, supported by fleet modernization and cost discipline. Liquidity is forecasted to stay above the 20% target by the end of 2025, despite planned fleet expansion and upcoming debt maturities. The Jet Forward program remains on track to deliver about USD 290 million in incremental EBIT by 2025, with cumulative EBIT improvements of USD 850 -950 million expected by 2027.
Top 10 Shareholders
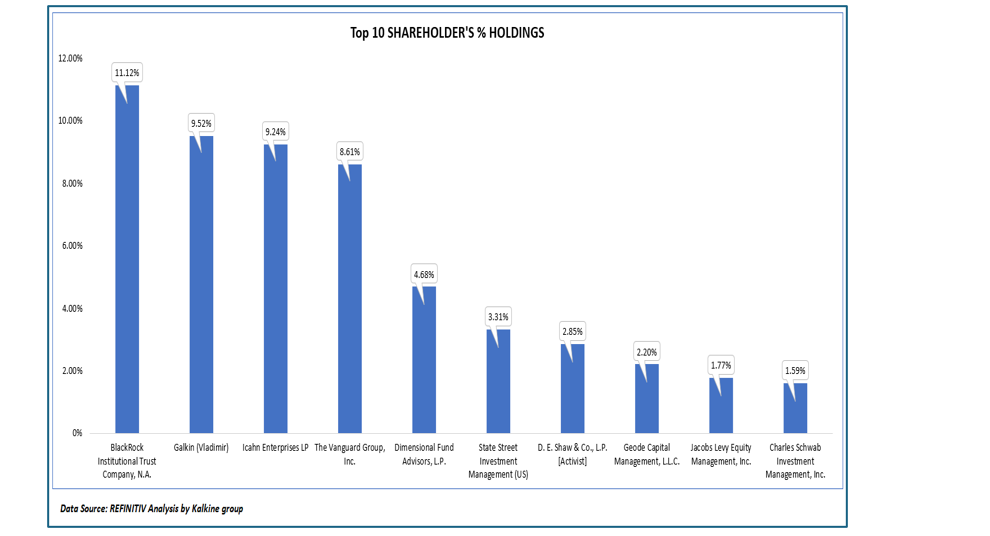
The top 10 shareholders collectively own about 54.90% of the company's total shares. BlackRock Institutional Trust Company, N.A., and Galkin (Vladimir) hold maximum stakes of 11.12% and 9.52%, respectively.
Stock Information
JBLU gained 20.9% over six months and 46.6% over nine months, while declining 29.6% year-on-year. The stock recorded a 52-week high of 8.31 on 21 January 2025 and a 52-week low of 3.34 on 16 April 2025.
Note 1: Past performance is not a reliable indicator of future performance.
Note 2: The reference date for all price data, currency, technical indicators, support, and resistance levels is January 16, 2025. The reference data in this report has been partly sourced from EODHD/Others.
Technical Indicators Defined: -
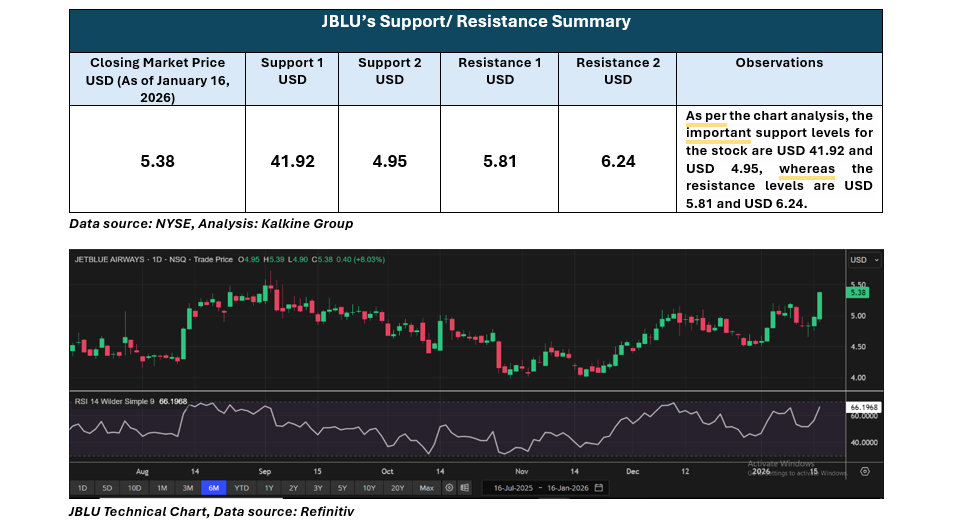
Support: A level at which the stock prices tend to find support if they are falling, and a downtrend may take a pause backed by demand or buying interest. Support 1 refers to the nearby support level for the stock and if the price breaches the level, then Support 2 may act as the crucial support level for the stock.
Resistance: A level at which the stock prices tend to find resistance when they are rising, and an uptrend may take a pause due to profit booking or selling interest. Resistance 1 refers to the nearby resistance level for the stock and if the price surpasses the level, then Resistance 2 may act as the crucial resistance level for the stock.
_06_12_2026_23_00_13_327450.jpg)


 Please wait processing your request...