
Highlights
- Halliburton’s Q3 net sales dropped 1.7% YoY to USD 5.6 bn, net income fell 96.6% YoY, and year-to-date operating cash flows declined 26.9% YoY.
- The company continued shareholder payouts, declaring a Q4 FY25 dividend of USD 0.17 per share.
- Management expects North America revenue to decline sequentially in Q4 FY25, while international markets are projected to post modest growth.
- Looking ahead, Halliburton plans lower 2026 capex of around USD 1 bn, ongoing cost savings, and continued emphasis on technology adoption
Halliburton Company (NYSE:HAL) supplies a broad range of products and services to the global energy industry. Its operations are organised into two main segments: Completion and Production, and Drilling and Evaluation.
In the third quarter of fiscal year 2025 (Q3FY25), the company reported net sales of USD 5,600 million compared with USD 5,697 million in Q3FY24, a change of negative 1.7%. Net income for Q3FY25 was USD 20 million versus USD 580 million a year earlier, reflecting a decline of 96.6% YoY. Operating cash flows year-to-date stood at USD 1,761 million compared with USD 2,409 million in the prior-year period, a decline of 26.9% YoY. Total cash and cash equivalents stood at USD 2,026 million versus USD 2,618 million in Q3FY24, reflecting a decline of 22.6% YoY.
Recent Business Update
In recent corporate updates, Halliburton announced that it would host its fourth quarter 2025 earnings conference call on January 21, 2026, at 8:00 a.m. CT, with the earnings press release to be posted on the company’s website before the call. The webcast would be accessible live on Halliburton’s website, with a replay available for seven days after the conference call. The company also announced a fourth quarter 2025 dividend of USD 0.17 per share, which was paid on December 24, 2025, to shareholders of record as of December 3, 2025.
Company Outlook
Halliburton reported a near-term and medium-term outlook focused on cost and capital management while navigating market volatility. The company expects North America revenue to decline 12%–13% sequentially in the fourth quarter of 2025 due to white space and seasonality, while international revenue is projected to grow 3%–4% on stable activity and software and completion tool sales.
Management guided to lower 2026 capital expenditures, targeting approximately USD 1 billion, or roughly a 30% reduction, and anticipates ongoing quarterly cost savings of about USD 100 million from workforce and asset optimizations. Management reaffirmed confidence in long-term oil and gas demand, continued technology adoption, including Zeus electric fleets and iCruise CX, and a differentiated value proposition to support performance and shareholder returns.
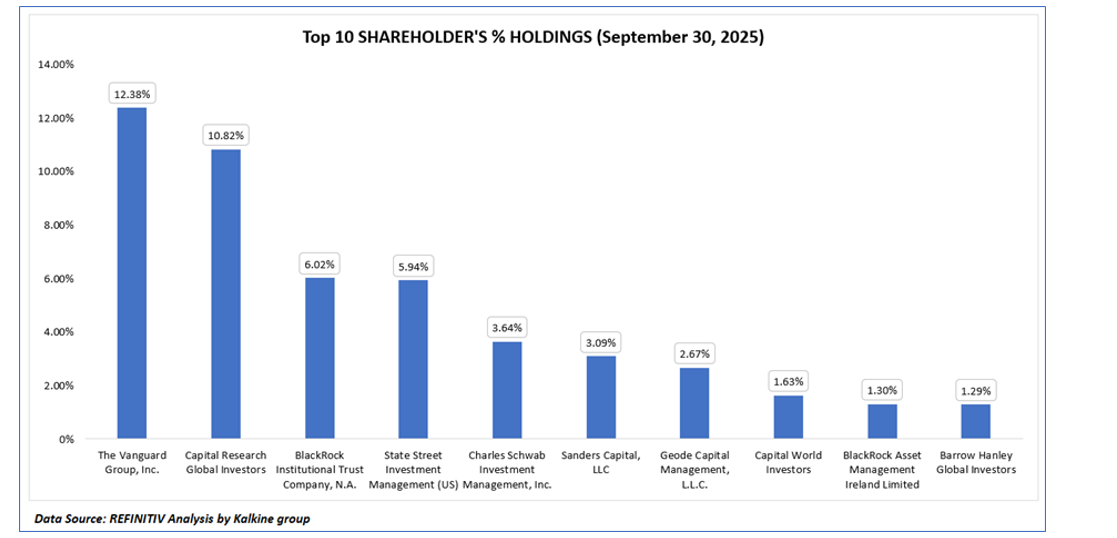
Top 10 Shareholders
The company’s ownership is relatively concentrated, with the top 10 shareholders collectively accounting for around 48.78% of total shareholding. The Vanguard Group, Inc. is the largest shareholder with an estimated 12.38% stake, followed by Capital Research Global Investors at approximately 10.82%.
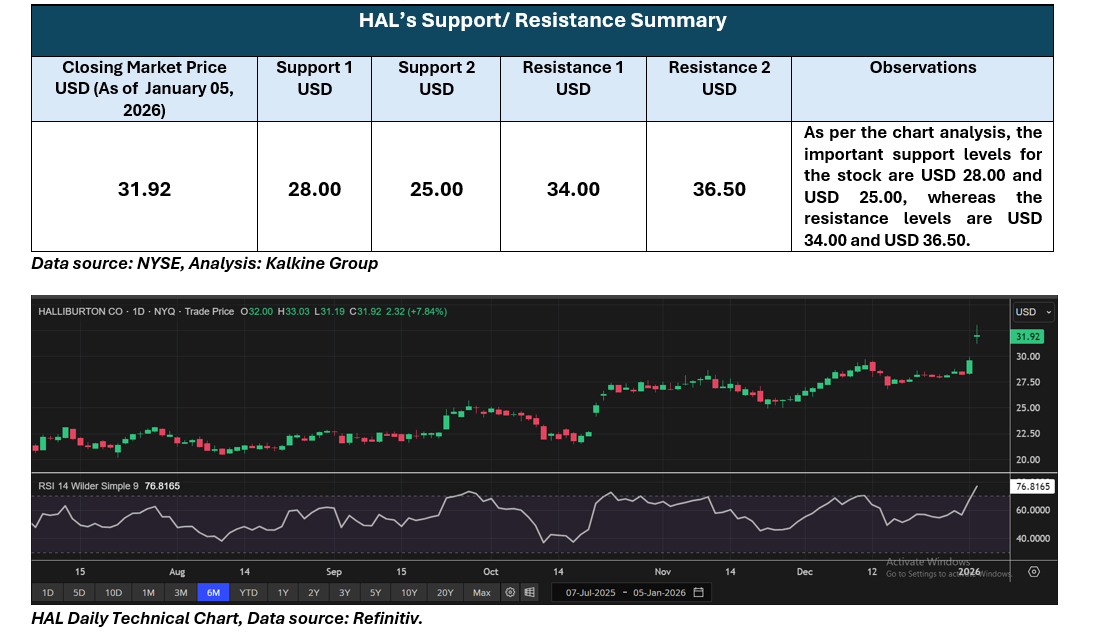
Share Performance
HAL closed at USD 31.92 on January 05, 2026, trading below its 52-week high of USD 33.03 (5 Jan 2026) and above its 52-week low of USD 18.72 (7 Apr 2025). Over the past 3 months, HAL returned ~31.03%, and over 6 months it gained ~52.80%.
Note 1: Past performance is not a reliable indicator of future performance.
Note 2: The reference date for all price data, currency, technical indicators, support, and resistance levels is January 05, 2026. The reference data in this report has been partly sourced from EODHD/Others.
Technical Indicators Defined: -
Support: A level at which the stock prices tend to find support if they are falling, and a downtrend may take a pause backed by demand or buying interest. Support 1 refers to the nearby support level for the stock and if the price breaches the level, then Support 2 may act as the crucial support level for the stock.
Resistance: A level at which the stock prices tend to find resistance when they are rising, and an uptrend may take a pause due to profit booking or selling interest. Resistance 1 refers to the nearby resistance level for the stock and if the price surpasses the level, then Resistance 2 may act as the crucial resistance level for the stock.
_06_12_2026_23_00_13_327450.jpg)


 Please wait processing your request...