_05_18_2026_23_56_07_556527.jpg)
A post-peak correction, a weekly RSI reset from extreme oversold, and a battle at converging EMAs — Bitcoin is at one of the most consequential weekly technical junctures of its current cycle
Key Highlights
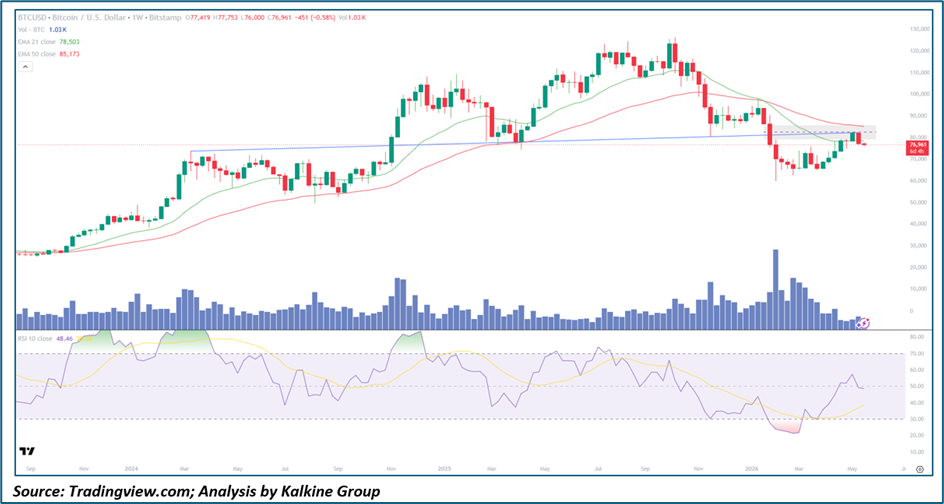
- Bitcoin (BTCUSD) is trading at $76,961, down -$451 (-0.58%) on the weekly candle, consolidating after a sharp recovery from the April 2026 low near $60,000
- The asset has corrected approximately 33% from its all-time high of ~$109,000 reached in late 2024/early 2025 — a magnitude consistent with mid-cycle corrections in prior Bitcoin bull runs
- EMA-21 ($78,503) and EMA-50 ($85,173) are both above current price on the Weekly Chart — the first time since the 2023 Bull Market launch that Bitcoin has traded below both weekly EMAs simultaneously
- Price is testing the confluence zone where the horizontal dotted support (~$76,000–$78,000) meets the blue long-term trend support line — a multi-year support level dating back to the 2023 accumulation base
- RSI-10 at 48.46 — recovering from a deeply oversold weekly reading near 22–25 (the red-shaded zone visible in April 2026) — the most washed-out RSI print since the 2022–2023 Bear Market bottom
- Volume at 1.03K BTC — declining, consistent with consolidation rather than a new directional impulse
- The chart spans from September 2023 to May 2026 — providing a complete bull-cycle-to-correction context rarely visible in a single chart
Trend Structure: A Complete Bull Cycle Mapped — Where Are We Now?
Bitcoin's weekly chart across this three-year window tells the complete story of a macro cycle — accumulation, impulse, distribution, and now the critical question: is this a mid-cycle correction or the early stage of a new bear market?
Phase 1 — Accumulation Base (Sep 2023 – Oct 2023) From the $25,000–$27,000 range, Bitcoin quietly built a weekly base with tight candlestick ranges, declining volume, and flat EMAs. The EMA-21 and EMA-50 were converged — classic late-stage accumulation before a major directional move.
Phase 2 — First Impulse (Nov 2023 – Mar 2024) The breakout above $30,000 triggered the first major impulse wave — a surge from $27,000 to $73,000 in just five months. This move was powered by spot Bitcoin ETF approval anticipation and institutional inflows that fundamentally changed the Demand structure of the market. The EMA-21 acted as reliable weekly support throughout, and volume expanded progressively with each leg higher.
Phase 3 — Mid-Cycle Consolidation (Apr 2024 – Sep 2024) The pullback from $73,000 to $55,000 following the April 2024 halving was a textbook mid-cycle consolidation — sharp enough to shake out weak hands, constructive enough to hold above the EMA-50. The RSI reset from overbought highs toward the 50 zone before the next phase launched.
Phase 4 — Peak Impulse and All-Time High (Oct 2024 – Jan 2025) The second and more powerful impulse wave drove Bitcoin from $55,000 to a confirmed all-time high above $109,000 — a move amplified by post-election institutional optimism, ETF flows accelerating beyond $1 billion per day, and the broader AI-crypto infrastructure narrative. This phase saw RSI push into deeply overbought territory on the weekly chart.
Phase 5 — Distribution and Correction (Feb 2025 – Apr 2026) The descent from $109,000 has been one of the most persistent corrections in Bitcoin's current cycle — a grinding 14-month decline from peak to trough that has tested $60,000 support on multiple occasions. The blue long-term trend support line, visible across the entire chart from the 2023 base, has been tested and — so far — held. The April 2026 low near $60,000 coincided with a weekly RSI washout into the 22–25 range — the most extreme oversold reading since the 2022 bear market nadir.
Current Phase — Recovery and Inflection (Apr 2026 – Present) The bounce from the April 2026 low has been both sharp and technically significant — recovering from $60,000 to nearly $78,000 in approximately six weeks, reclaiming the long-term trend support line and moving back toward the EMA-21. Bitcoin is now at the most critical weekly decision point of the current cycle.
The Critical Confluence Zone: Three Technical Forces Converge at $76,000–$80,000
The current price action is occurring within a technically extraordinary confluence zone — a region where multiple independent support and resistance forces intersect simultaneously, creating a high-stakes decision area:
- The Horizontal Dotted Support (~$76,000–$78,000) This level, visible as the horizontal dotted line extending across the entire chart from the 2024 period, represents a major prior resistance level that was broken to the upside during the 2024 bull run and now — in theory — should act as support on the retest. The ability of Bitcoin to hold above this level on a weekly closing basis is a critical technical requirement for the bull case.
- The Blue Long-Term Trend Support Line The diagonal blue support line, which connects the 2023 accumulation lows and has underpinned the entire bull cycle, is currently intersecting with price in the $75,000–$78,000 zone. This multi-year Trendline represents the structural foundation of the current cycle — a weekly close below it would be a significant negative signal.
- The EMA-21 ($78,503) The weekly EMA-21 sits just above current price at $78,503 — acting simultaneously as overhead resistance and the minimum requirement for a bullish trend restoration. A sustained weekly close above $78,503 would be the first signal that the correction phase is transitioning back to accumulation or impulse.
The convergence of these three levels within a $3,000–$4,000 range creates a zone of maximum technical significance — and the weekly candle currently being formed will provide critical information about which force is dominant.
Moving Averages: The Weekly Death Cross Scenario
- EMA-21 ($78,503) — declining from the $100,000+ levels of the peak phase, now acting as the immediate overhead resistance; reclaiming this level on a weekly close is the minimum requirement for a trend change signal
- EMA-50 ($85,173) — still elevated from the bull phase but declining, approximately $8,000 above current price — representing the major resistance ceiling on any recovery
The configuration of price below both weekly EMAs — with the EMA-21 declining toward the EMA-50 — raises the prospect of a weekly EMA death cross if the correction persists. Historically, Bitcoin's weekly EMA death crosses have been among the most bearish signals in its price history, typically preceding extended bear markets. However, the current setup differs meaningfully from prior death cross events: the long-term trend support line is holding, the RSI has already flushed to bear-market-grade oversold levels, and the macro context — spot ETF structural demand and the halving Supply shock — is fundamentally different from the 2022 environment.
Momentum: The RSI Reset That Matters Most
The RSI-10 at 48.46 is the most important single indicator on this chart for medium-term investors. The trajectory is clear: from a weekly RSI near 22–25 in April 2026 — the red-shaded zone of peak pessimism visible at the bottom of the RSI panel — the indicator has recovered sharply to the neutral 50 zone in just six weeks.
This RSI trajectory mirrors almost exactly the recovery patterns seen at the 2022 bear market bottom and the 2020 COVID crash low — both of which saw the weekly RSI flush to the 20–25 zone before a sustained recovery that ultimately led to new cycle highs. The comparison is instructive but not deterministic — the key differentiator in each case was whether the price held above the long-term trend support on the RSI recovery, which is precisely the test occurring right now.
The signal line (yellow) at approximately 36 remains below the RSI at 48.46, confirming the upward crossover of momentum is in progress. The next critical RSI milestone is a sustained hold above 50, which would confirm the return of net positive momentum on the weekly timeframe — a level that has historically coincided with the beginning of the next directional advance.
Key Technical Levels and Scenarios
Resistance Levels
- $78,503 — EMA-21 (weekly) — immediate and critical resistance; the trend-change trigger
- $80,000 — Psychological resistance and prior support/resistance zone
- $85,173 — EMA-50 (weekly) — major structural resistance
- $89,000–$92,000 — Prior distribution base and high-volume supply zone
- $100,000 — Psychological milestone and bull case confirmation level
- $109,000 — All-time high — ultimate bull case target
Support Levels
- $76,000–$78,000 — Current confluence zone (horizontal support + long-term trendline)
- $73,000–$75,000 — Prior 2024 all-time high zone — structural support
- $65,000–$68,000 — Mid-cycle correction low zone from 2024
- $60,000 — April 2026 recovery low and critical cycle low — ultimate stop reference
- $55,000–$57,000 — EMA-50 weekly trend extension — bear case target if cycle low breaks
Scenarios
- Bullish Continuation — The Mid-Cycle Recovery (Primary Case) Weekly RSI holds above 50, price closes above the EMA-21 at $78,503 on a sustained basis, and the long-term trendline provides the foundation for a new advance toward $85,000–$90,000. The fundamental drivers — spot ETF inflows resuming, post-halving supply compression, and institutional allocation acceleration — underpin this scenario as the highest-probability medium-term outcome. Target: $85,000–$90,000 initially, $100,000 on confirmation.
- Extended Consolidation — Base Building (Secondary Case) Bitcoin oscillates between $72,000–$82,000 for 4–8 weeks, building a weekly consolidation base similar to the April–September 2024 mid-cycle pause. The EMAs converge and begin to flatten, RSI stabilises in the 45–60 range, and the setup for the next directional move improves significantly. This is a constructive outcome for patient medium-term holders and represents the most likely near-term path if the immediate EMA-21 test fails.
- Trendline Breakdown and Retest of Cycle Lows (Bear Case) A weekly close below the blue trendline and $73,000 horizontal support triggers a retest of the $60,000 April low. Given the macro environment — rising Treasury yields, rate hike risk, and geopolitical-driven risk-off sentiment — this scenario cannot be dismissed. A sustained break below $60,000 would signal a full cycle trend change and open the path toward $50,000–$55,000.
The Bear Case: Four Macro Headwinds That Cannot Be Ignored
Despite the constructive long-term structure, the current environment presents real cyclical risks:
Rising Real Yields — The U.S. 10-year Yield/">Treasury Yield at 4.60% and 30-year at 5.13% represent the highest real yield environment Bitcoin has faced since its current bull cycle began. High real yields directly compress the relative attractiveness of non-yielding Assets, and the historical inverse correlation between BTC and real yields has intensified with institutional participation.
Rate Hike Re-Pricing — Markets now assign a 45% probability to at least one Fed rate hike in 2026 — a complete Reversal from the near-zero probability just one month ago. A rate hike in this environment would be materially negative for risk assets, including Bitcoin.
Geopolitical Risk-Off — The ongoing U.S.-Iran conflict is creating a macro risk-off backdrop that has historically correlated with BTC underperformance in the short-to-medium term, as Bitcoin has increasingly traded as a high-Beta Risk Asset rather than the "digital gold" safe haven narrative suggests.
Weekly EMA Death Cross Risk — If the EMA-21 continues declining and price fails to reclaim it within the next 2–4 weeks, the probability of a weekly death cross — historically one of Bitcoin's most bearish signals — will materially increase.
Conclusion: The Most Important Weekly Close in Bitcoin's Current Cycle
Bitcoin is at a weekly inflection point of rare significance — a three-way technical confluence of horizontal support, long-term trendline, and declining EMA-21 creating a decision zone that will define the medium-term trajectory of the current cycle.
The weight of evidence from prior cycle analogues, the RSI reset from extreme oversold, and the fundamental supply/demand structure of a post-halving environment with spot ETF inflows suggest the bull case deserves the benefit of the doubt — but not unconditionally.
The framework is precise: a weekly close above $78,503 (EMA-21) is the minimum bull signal, opening the path toward $85,000–$90,000. A weekly close below $73,000 with declining RSI is the warning, and a sustained break below $60,000 is the cycle invalidation level that would demand a complete reassessment of the medium-term thesis.
For long-term holders, the current zone represents one of the most historically reliable accumulation windows of any Bitcoin cycle. For traders, the next weekly close is the only data point that matters — and it will tell you whether the April low was the bottom, or merely the first test of one.
_06_12_2026_23_00_13_327450.jpg)


 Please wait processing your request...