_10_09_2025_06_55_28_920134.jpg)
Highlights
- Q2FY26 revenue rises 19% to USD 29,776 million, led by ISG performance.
- Net income increases 32% to USD 1,164 million; operating expenses reduced 4%.
- Company declares quarterly dividend of USD 0.525 and announces CFO transition.
Dell Technologies Inc. (NYSE:DELL) offers a broad range of integrated technology solutions, products, and services across design, development, manufacturing, marketing, sales, and support. The company’s operations are structured into two segments: Infrastructure Solutions Group (ISG) and Client Solutions Group (CSG).
Dell Technologies reported total net revenue of USD 29,776 million in Q2FY26, a 19% increase compared to USD 25,026 million in Q2FY25. The growth was driven by higher demand for AI servers and steady performance in the Infrastructure Solutions Group, supported by new product launches and modernization initiatives. Net income attributable to the company rose 32% to USD 1,164 million from USD 882 million, reflecting higher revenue, improved operating efficiency, and a 4% reduction in operating expenses. Cash inflow from operating activities increased 89.8% to USD 2,543 million from USD 1,340 million, supported by earnings growth, working capital management, and operational discipline. Cash and cash equivalents stood at USD 8,145 million, up 124.2% from USD 3,633 million, reflecting higher cash generation, capital management measures, and improved liquidity.
Business Update
In September 2025, Dell Technologies announced two key corporate updates. On September 04, the company declared a quarterly cash dividend of USD 0.525 per common share, payable on 31 October 2025 to shareholders of record as of 21 October 2025. Earlier in February, the board had approved an 18% increase in the annual cash dividend to USD 2.10 per share, reflecting its commitment to consistent shareholder returns. On September 08, Dell announced a CFO transition, with Yvonne McGill stepping down from her role effective 9 September 2025 after nearly three decades with the company. David Kennedy, Senior Vice President of Dell Global Business Operations, Finance, and former CFO of the Client Solutions Group, has been appointed Interim CFO. Yvonne McGill will continue advising through Q3 FY2026 to ensure a smooth transition.
Outlook
Dell Technologies expects revenue for fiscal year 2026 to be between USD 105.0 billion and USD 109.0 billion, representing a 12% year-over-year increase at the midpoint of USD 107.0 billion. GAAP diluted EPS is projected at USD 7.98 and non-GAAP diluted EPS at USD 9.55 at the midpoint, indicating growth of 25% and 17%, respectively. For Q3 FY26, the company forecasts revenue in the range of USD 26.5 billion to USD 27.5 billion, up 11% year over year at the midpoint of USD 27.0 billion, with GAAP diluted EPS of USD 2.07 and non-GAAP diluted EPS of USD 2.45, reflecting 26% and 11% year-over-year growth, respectively.
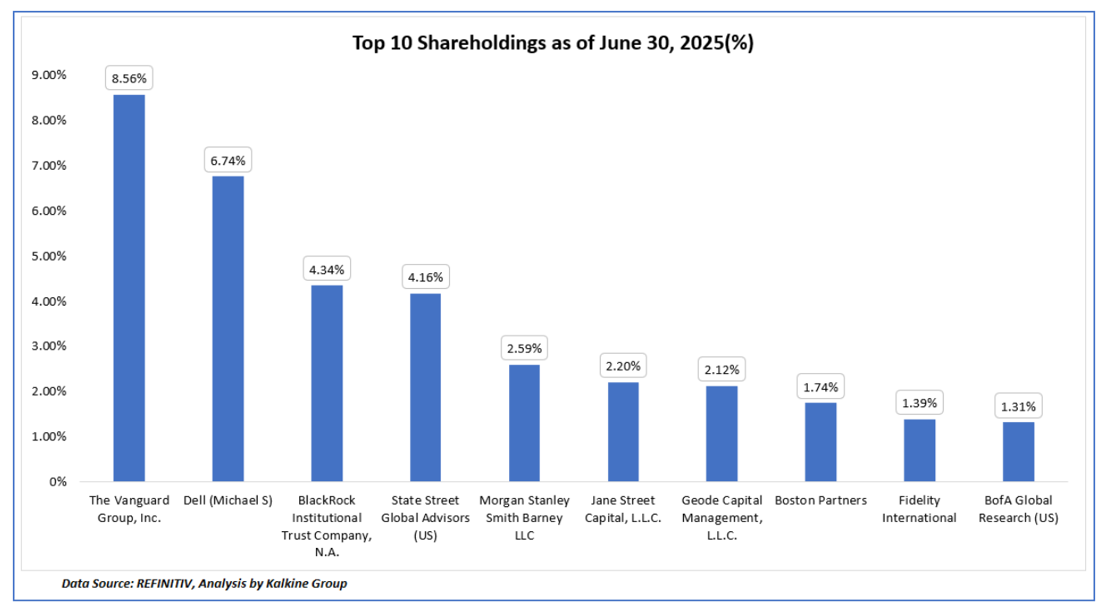
Top 10 Shareholders
The top 10 shareholders of DELL collectively hold 35.15% of the total shareholding, indicating a concentrated ownership structure. The Vanguard Group, Inc. and Michael S. Dell are the largest shareholders, with stakes of approximately 8.56% and 6.74%, respectively.
Stock Information
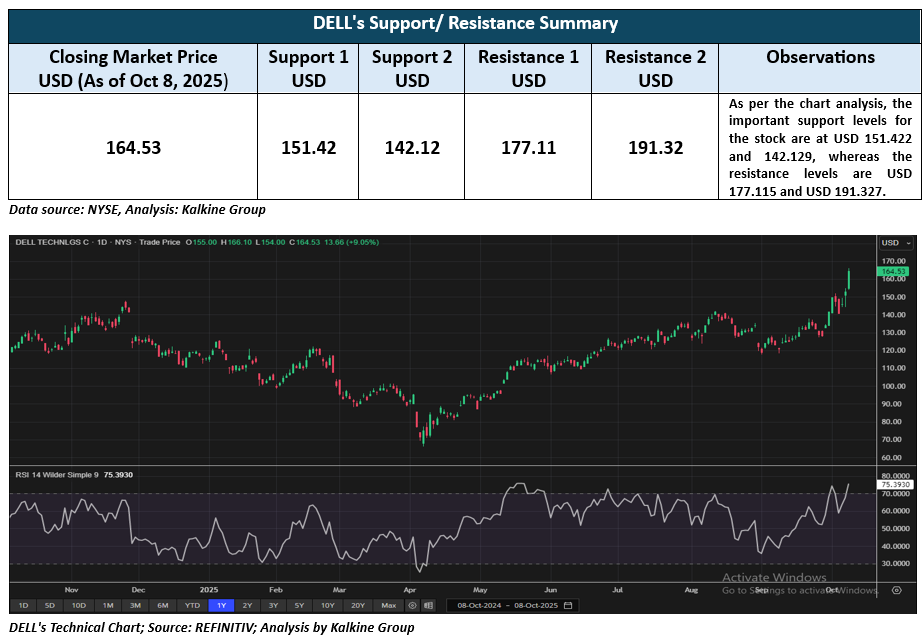
As of the closing price of October 8, 2025 (USD 164.53), the stock gained about 29.92% over the past three months and 95.42% over the last six months. It is currently trading within the upper portion of its 52-week price range, which extends from a low of USD 66.24 to a high of USD 164.53.
Note 1: Past performance is not a reliable indicator of future performance.
Note 2: The reference data for all price data, currency, technical indicators, support, and resistance levels Is October 8, 2025. The reference data in this report has been partly sourced from EODHD/Others.
Technical Indicators Defined
Support: A level at which the stock prices tend to find support if they are falling, and a downtrend may take a pause backed by demand or buying interest. Support 1 refers to the nearby support level for the stock and if the price breaches the level, then Support 2 may act as the crucial support level for the stock.
Resistance: A level at which the stock prices tend to find resistance when they are rising, and an uptrend may take a pause due to profit booking or selling interest. Resistance 1 refers to the nearby resistance level for the stock and if the price surpasses the level, then Resistance 2 may act as the crucial resistance level for the stock.
_06_12_2026_23_00_13_327450.jpg)


 Please wait processing your request...