
On Wednesday, March 11, 2026, Wall Street experienced a distinctly bifurcated trading session. Investors were forced to navigate a tug-of-war between blockbuster tech earnings and mounting macroeconomic anxieties. The S&P 500 and Dow Jones Industrial Average slipped into negative territory, while the tech-heavy Nasdaq managed to eke out marginal gains.
Here is a breakdown of the major catalysts that drove the market:
The Tech Savior: Oracle's Earnings Beat
The undisputed star of the session was the Information Technology sector, which single-handedly provided a valuation floor for the broader market and eased fears of an AI slowdown.
- Oracle (ORCL) Surges: Shares jumped over 9% to close above $163 after reporting its best fiscal quarter in 15 years.
- Explosive AI Demand: The company announced a staggering $553 billion backlog and a 44% spike in cloud revenue, proving that enterprise demand for AI infrastructure remains robust. This optimism spilled over into other semiconductor and software names like Nvidia and Micron.
The Geopolitical Hedge: Energy and Defense
On the other side of the spectrum, the "risk-off" trade was dominated by escalating military conflict in the Middle East.
- Strait of Hormuz Tensions: The ongoing conflict involving Iran has sent shockwaves through global energy markets, forcing traders to price in severe supply chain disruptions.
- Oil Volatility: West Texas Intermediate (WTI) crude settled around $83.45/bbl. While it pulled back slightly from a massive spike earlier in the week, Energy stocks like ExxonMobil and Chevron saw continued interest as a natural hedge against the chaos. Defense contractors also rallied on the news.
Macro Pressures: Sticky Inflation and Consumer Squeeze
Beyond tech and energy, the rest of the market felt the heavy weight of persistent economic realities and shifting yield curves.
- Hawkish CPI Data: February's Consumer Price Index arrived at 2.4% year-over-year. Because this data was collected before the recent energy shock, markets realized that inflation is stickier than expected, pushing out hopes for near-term Federal Reserve rate cuts.
- Yield-Sensitive Selloffs: With the 10-year Treasury yield hovering around 4.12%, Real Estate and traditional "bond-proxy" Utilities suffered heavy pullbacks as capital rotated out of defensives.
- Staples Stumble: Consumer Staples took a hit, highlighted by Campbell Soup dropping 4% after missing revenue estimates, a clear signal that prolonged inflation is finally squeezing everyday consumer spending.
Daily US Sector Performance Summary
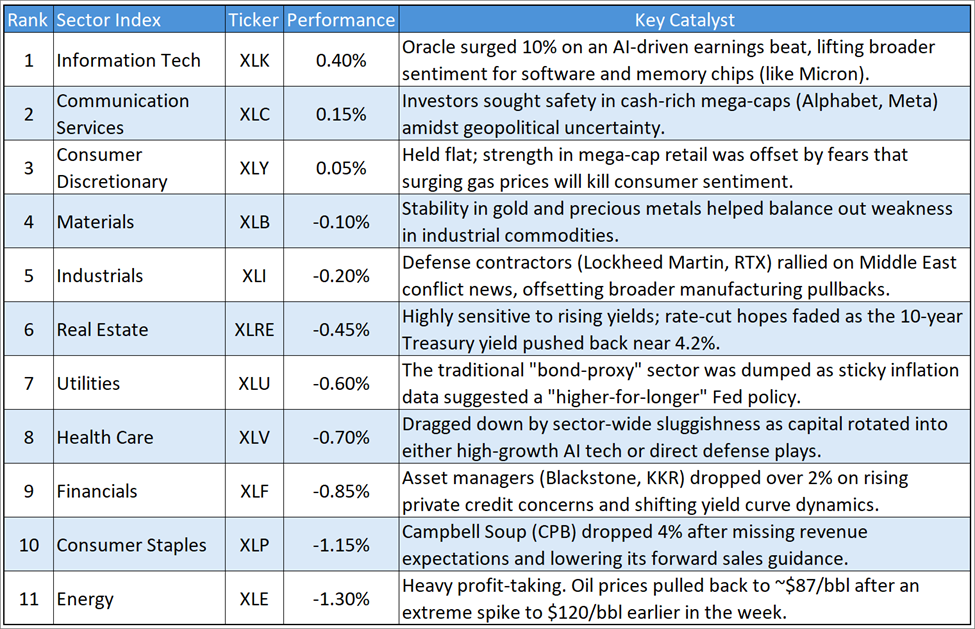
US Sector Daily Relative Momentum Chart
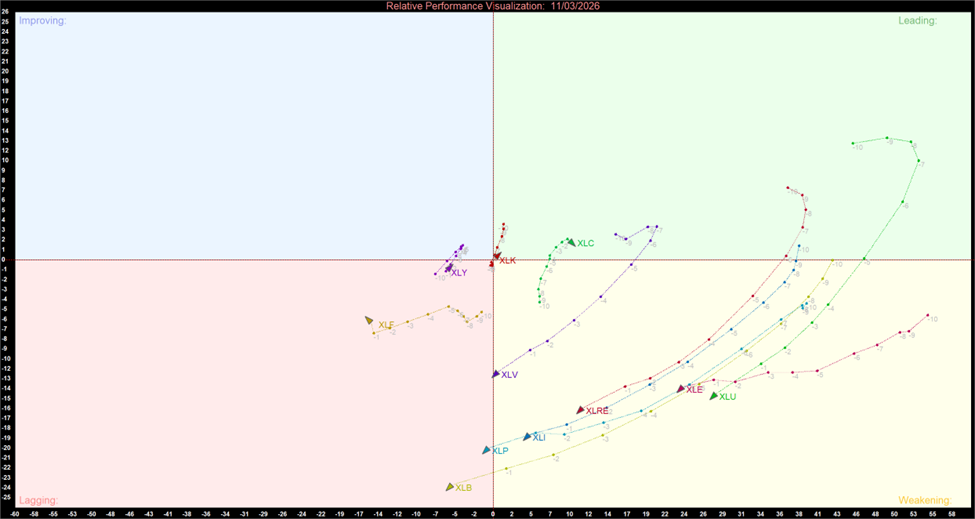
US Sector Relative Momentum Daily Chart (at the closing price of 11th March 2026). Powered by: amibroker.com
- Leaders: XLC and XLK are trending in the Leading quadrant with superior short-term momentum. XLC remains the relative leader despite slight cooling in the latest session, while XLK is gaining significant upward trajectory.
- Laggers: XLB, XLV, XLP, XLU, XLE, XLRE, and XLI exhibit fading short-term momentum as they rotate toward the Lagging quadrant.
_06_12_2026_23_00_13_327450.jpg)


 Please wait processing your request...