
Powell Max Limited (Nasdaq:PMAX) posted a 31.15% single-session move on 13 May 2026, closing at USD 3.41 as the deeply micro-cap name attracted speculative interest within a broader risk-on small-cap environment.
Key Highlights
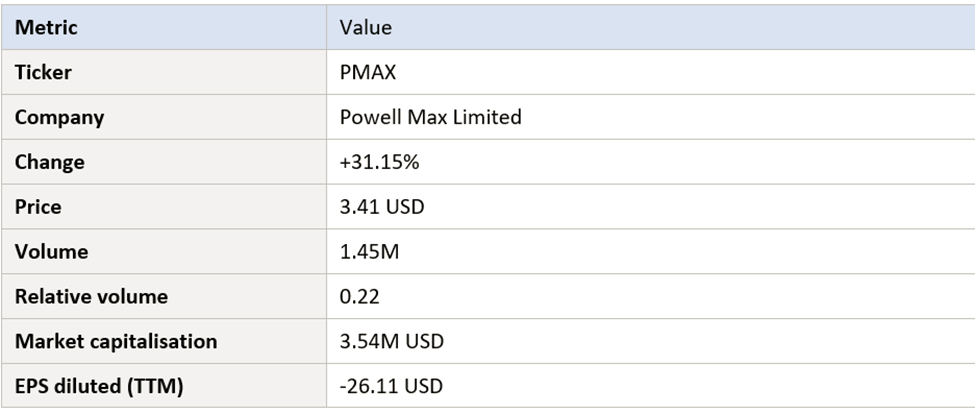
- PMAX closed at USD 3.41, up 31.15% on the session.
- Volume of 1.45 million shares represented 0.22× normal activity, a comparatively low relative volume reading.
- Market Capitalisation was reported at just USD 3.54 million, placing PMAX among the smallest names on the screener.
- Trailing twelve-month diluted EPS was -USD 26.11, an unusually large negative figure.
- Deep micro-caps with very low market caps can experience sudden swings on modest dollar flows.
What Happened
Powell Max Limited (NASDAQ:PMAX) was featured among the gainers on Top Gaining US Stocks for 13 May 2026. The screener recorded a price of USD 3.41 and a single-session change of 31.15%, alongside reported volume of 1.45 million shares.
An unusual feature of PMAX's screener line is the relative volume reading of 0.22, which is well below 1. That figure suggests that, despite the sharp percentage move, total trading activity was actually below the stock's typical baseline for the period covered by the reading. This combination — high price change and low relative volume — can arise in deep micro-caps where individual orders represent a large share of the historical norm.
With a market capitalisation of approximately USD 3.54 million, PMAX is among the smallest names on the day's gainers list. That size implies a very limited share count and modest free float, conditions under which even small absolute dollar flows can move the price materially.
Market Context
The 13 May 2026 session was characterised by broad-based risk-on activity in US small-caps, with extreme moves clustered across thematically diverse names. Deep micro-caps like PMAX often participate in such environments, even when individual stories are not directly connected to dominant market themes.
Trading dynamics in the deepest end of the US micro-cap universe are distinct from those in larger small-caps. Limited float, thin order books, and low Average Daily Volume mean that even modest absolute flows can produce outsized percentage moves. The behaviour of any single name on a given day can therefore reflect very localised dynamics, including a small handful of active participants.
Within this environment, PMAX's relatively low relative volume reading is unusual but not unprecedented. Stocks at the very smallest end of the market can sometimes experience meaningful price moves on volumes that, in absolute terms, are lower than for more actively traded names.
Investors approaching the deepest micro-cap segment should therefore be conscious of the structural conditions — including float, listing status, and reporting cadence — that shape its Volatility profile.
Company Overview
Powell Max Limited is a US-listed company, under the ticker PMAX. As of the 13 May 2026 screener snapshot, the company's market capitalisation was approximately USD 3.54 million, placing it among the smallest listed names on the screener.
The trailing twelve-month diluted EPS figure of -USD 26.11 is unusually large in magnitude. Such figures in micro-caps are often heavily influenced by share count changes, including reverse splits, and by one-off non-cash charges. Investors should be cautious about treating per-share Earnings metrics at Face Value without examining the underlying income statement and Capital-structure/">Capital Structure.
From a market-behaviour standpoint, PMAX is best characterised as a deep micro-cap with the volatility profile and Liquidity constraints typical of its size band.
Screener Data
The data line for PMAX is unusual in several respects. The combination of a 31% price move with a relative volume reading of 0.22 is uncommon and points to the role of structural micro-cap dynamics, including very thin baseline trading activity.
The market capitalisation of USD 3.54 million is among the smallest of any name on the day's screener, underscoring how little capital it can take to influence the stock's price meaningfully. For investors, this means execution risk in either direction can be substantial.
Finally, the trailing EPS reading of -USD 26.11 is extreme and warrants careful scrutiny. Per-share figures in deep micro-caps can be distorted by capital-structure events and should not be interpreted in isolation.
Risks to Watch
Liquidity and execution risk
With a market capitalisation around USD 3.5 million and a low relative volume reading, PMAX's order book is likely thin. Execution risk — particularly during periods of stress — can be material.
Capital-structure distortion
Deep micro-caps frequently undergo reverse splits, secondary offerings, and Warrant exercises. These actions can distort per-share metrics and create timing-related risks for shareholders.
Listing and disclosure risk
Names at this end of the market can be subject to additional scrutiny around listing requirements and disclosure standards. Investors should monitor exchange notices closely.
Trading Patterns and Liquidity
Beyond the headline +31.15% change, the trading pattern visible from the screener provides a useful lens on how Powell Max Limited actually moved through the session. The combination of a 3.41 USD reference level, reported volume of 1.45M, and a relative volume reading of 0.22 is informative in itself. Each of these figures captures a different facet of the market's reaction: price reflects the marginal valuation, volume measures aggregate participation, and relative volume contextualises that participation against the stock's own history.
In a market cap band reported at 3.54M USD, sustained moves typically require either a meaningful change in the perceived fundamental story or a substantial shift in the composition of the stock's investor base. One-day spikes that are not anchored in confirmed catalysts can be informative about market psychology but provide limited evidence about durable value creation. Traders evaluating PMAX in the days that follow will want to watch whether the elevated volume profile is sustained, whether intraday ranges narrow, and whether bid-ask spreads tighten as the session's enthusiasm normalises.
Liquidity considerations also matter. When a stock's traded volume runs at multiples of its average, the order book can briefly look very different from its usual state. In particular, market depth — the size of resting orders at each price level — can appear larger than it really is during the spike and thinner than it really is once the rush fades. For PMAX, that means execution conditions encountered during the 13 May 2026 session may not be representative of typical days, and investors should plan position sizing and exit strategies accordingly.
How This Move Compares to Other Top Gainers
Placing PMAX's +31.15% move in context with other names on the 13 May 2026, Top Gaining US Stocks screener helps highlight what made the session distinctive. On the same day, leaderboard names ranged from deeply micro-cap issuers such as Dreamland Limited (TDIC) and Fitness Champs Holdings (FCHL) to larger small- and mid-caps like Ouster (OUST) and SELLAS Life Sciences (SLS). That breadth — both in sector and in market capitalisation — suggests the day's risk-on tone was broadly distributed rather than confined to a single theme.
Within that mixed cohort, PMAX sat alongside companies from healthcare, advanced Manufacturing, energy transition, and financial services. Although each of these names has its own operating story, their simultaneous appearance on the screener illustrates a pattern frequently observed in US markets: when small- and micro-cap appetite returns, capital tends to disperse across themes rather than concentrate in one. That dispersion can itself be a signal worth tracking, because it differentiates broad-based risk-on sessions from sentiment events focused on a single sector.
The relative-volume reading of 0.22 for PMAX should be read against the wide range observed in the day's gainers. Some names featured relative volumes in the high 20s, 30s, and even above 70, while others showed more moderate spikes in the 2–6 range. Where a particular stock sits in that distribution offers a clue about how unusual the day's activity was for that specific name — a more meaningful comparison than focusing solely on the headline percentage gain.
Investor Outlook
For PMAX, the immediate outlook is dominated by the structural realities of deep micro-cap trading. Without a confirmed catalyst, the 13 May 2026 move is best understood as an episode within a broader speculative session rather than as the start of a fundamentally driven re-rating.
Long-term investors should approach deep micro-caps like PMAX with caution, recognising that the underlying Business may have limited visibility from public data alone, and that capital-structure events can have outsized effects on Shareholder outcomes.
Short-term traders should focus on liquidity, execution, and risk management. Position sizes consistent with the depth of the order book — and clearly defined exit points — are typical features of disciplined trading in stocks of this size.
In aggregate, PMAX's appearance on the screener offers a clear example of how deep micro-cap dynamics can produce eye-catching single-day moves on volume that is, in absolute terms, comparatively limited.


_06_22_2026_22_24_35_995661.jpg)


 Please wait processing your request...