
Key Highlights
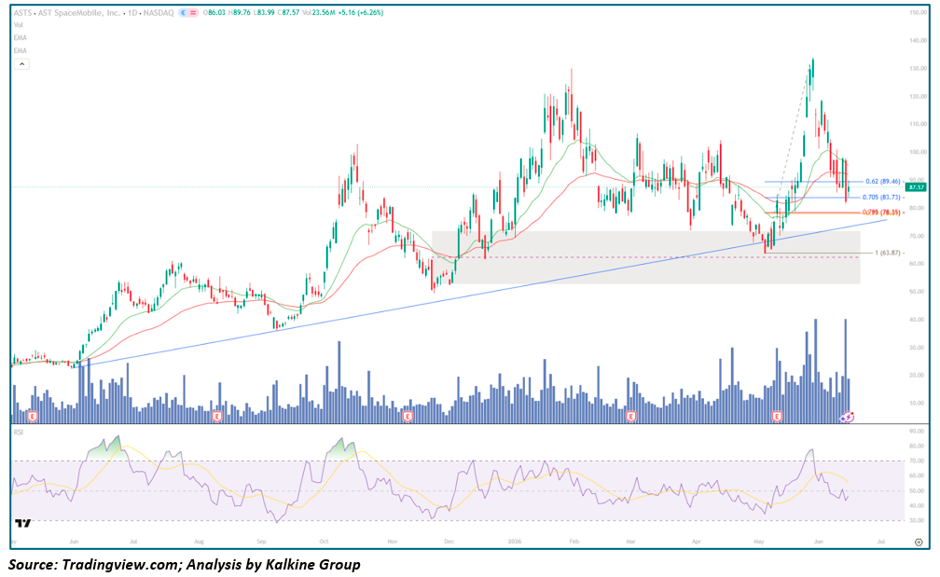
- ASTS closed at $87.57, up +$5.16 (+6.26%) on volume of 23.56M shares, with an intraday range of $83.99-$89.76 reflecting a strong recovery bounce off the 0.62 Fibonacci retracement level at $89.46
- The stock staged an explosive rally from the ~$64 low in early May to the cycle high near $135 in early June, an advance of over 100% in roughly five weeks, before entering a sharp corrective phase
- Price is currently bouncing near the confluence of the 0.62 Fibonacci retracement ($89.46), the rising long-term trendline (blue diagonal), and the 0.705 level ($83.73), creating a multi-factor support cluster
- RSI-14 has recovered from the low-40s back toward the mid-50s, recrossing above the RSI signal line and suggesting early stabilization after the sharp pullback from the June peak
- Both EMAs are sloping downward following the post-peak decline, with price still trading below both moving averages despite today's bounce, keeping the near-term trend technically bearish
- The 0.785 Fibonacci level at $78.35 and the 1.0 level at $63.87 (marking the origin of the May rally) represent the deeper support zones if the current bounce fails to hold
Trend Structure: Multi-Phase Cycle From Mid-2025 Range Trading to the Explosive 2026 Breakout and Current Retracement Test
Phase 1 — Range-Bound Trading and Initial Higher-Low Structure (Jun – Sep 2025)
ASTS spent the summer of 2025 trading in a relatively contained range, generally between $20 and $35, with both EMAs running close together and RSI oscillating in a neutral 40-60 band for much of this period. A clear higher-low structure began forming, visible in the rising blue trendline drawn from the early-June lows, laying the foundation for the advance that followed. RSI pushed into overbought territory above 80 briefly in late June/early July, reflecting an initial burst of speculative interest before consolidation resumed.
Phase 2 — Breakout to New Highs and October Peak (Sep – Oct 2025)
A sharp breakout in late September propelled price from the high-$20s/low-$30s toward a cycle high near $50 by early October. RSI again surged above 80 during this advance, one of the most overbought readings on the chart, before the stock entered a corrective phase that took price back down toward the $35-$45 range through October and November. Both EMAs turned higher during this phase, with the green EMA providing dynamic support on pullbacks.
Phase 3 — Consolidation and Base Building (Nov 2025 – Jan 2026)
From November through January, ASTS carved out a wide consolidation range roughly between $55 and $70 (the gray shaded zone on the chart), with the 1.0 Fibonacci level at $63.87 sitting near the middle of this base. RSI oscillated without strong directional conviction during this period, dipping to oversold levels near 30 in late November before recovering. This extended base ultimately served as the launchpad for the powerful advance that followed.
Phase 4 — Major Advance to the February Peak (Jan – Feb 2026)
Price broke out of the consolidation range in January, advancing sharply from the low-$60s toward a cycle high near $135-$140 by mid-February — one of the largest moves visible on the chart. RSI pushed into deeply overbought territory above 80 during this surge, with both EMAs turning sharply higher and the green EMA providing consistent support throughout the climb. The subsequent reversal from the February peak was swift, with price declining back toward the $80-$100 range by March.
Phase 5 — Extended Consolidation and Range Trading (Mar – Apr 2026)
Through March and April, ASTS settled into a broad sideways range roughly between $75 and $105, with both EMAs flattening and converging. RSI oscillated in a neutral-to-bullish 45-65 band during this period, with the stock testing both the upper and lower boundaries of the range multiple times without a decisive breakout in either direction — a classic basing pattern after the sharp February decline.
Phase 6 — Explosive May-June Rally to New Highs (May – Jun 2026)
The most dramatic move on the chart began in early May, with price surging from the ~$64 low (coinciding with the 1.0 Fibonacci level and the dashed horizontal line at $63.87) in a near-vertical advance to a new cycle high near $135 by early June. This move, traced by the dashed diagonal trendline, represents a gain of over 100% in approximately five weeks. RSI pushed back above 80 at the peak of this move, signaling extreme overbought conditions and setting up the subsequent pullback.
Phase 7 — Post-Peak Retracement and Fibonacci Support Test (Mid-Jun 2026)
Since the early-June peak near $135, price has declined sharply, breaking below both EMAs and retracing toward the 0.62 Fibonacci level. Today's session shows a strong bounce from this zone, with price recovering from the $83.99 intraday low to close at $87.57 — right at the 0.62 Fibonacci level ($89.46) and just above the rising long-term trendline, which now intersects price action in this area.
Moving Averages: EMAs Rolling Over From the June Peak, Price Testing From Below
Both the shorter (green) and longer (red) EMAs turned sharply downward following the early-June peak, reflecting the speed and severity of the pullback from $135. Price remains below both moving averages despite today's bounce, keeping the near-term trend bearish. A close back above the red EMA (in the $95-$100 area based on its recent path) would be the first signal that the retracement has stabilized, while continued trading below both EMAs would suggest the bounce is occurring within a still-active corrective decline.
Momentum Analysis: RSI Recovers From the 40s, Crossing Back Above the Signal Line
RSI-14's recovery from the low-40s toward the mid-50s represents a meaningful cross above the RSI signal line (yellow) after the sharp decline from overbought levels above 80 at the June peak. This pattern — a rapid RSI round-trip from overbought to near-neutral followed by a stabilizing bounce — mirrors similar resets seen after the October 2025 and February 2026 peaks, both of which were followed by extended consolidation phases before the next major move. A sustained hold above 50 on any retest of today's lows would strengthen the case that momentum has reset to a healthier level following the parabolic June spike.
Key Technical Levels
Resistance Levels
- $95.00-$100.00 — red EMA confluence and near-term resistance from the early-June consolidation
- $105.00-$110.00 — prior resistance zone from the March-April range
- $120.00-$125.00 — secondary resistance below the cycle high
- $135.00-$140.00 — cycle high and ultimate bull target on a recovery continuation
Support Levels
- $89.46 — 0.62 Fibonacci retracement, the level currently being tested and defended
- $83.73 — 0.705 Fibonacci retracement and today's intraday low zone
- $78.35 — 0.785 Fibonacci retracement, the next major support if $83-$84 fails
- $63.87 — 1.0 Fibonacci level, origin of the May rally and the gray consolidation zone; a return here would represent a full retracement of the explosive May-June advance
Scenario Analysis
- Bullish Stabilization (Constructive Case) — If ASTS holds above the 0.62 Fibonacci level ($89.46) and the rising trendline, with RSI continuing to build above 50: price could grind back toward the red EMA resistance near $95-$100, with a stronger recovery targeting the $105-$110 zone and eventually a retest of the $120-$125 area below the cycle high.
- Deeper Fibonacci Retracement (Constructive But Painful) — A break below $83.73 (0.705 Fib) opens the path toward $78.35 (0.785 Fib), which would represent roughly a 42% pullback from the $135 peak. A hold and reversal from this zone, especially if RSI reaches oversold levels near 30-35, would offer a higher-conviction entry for bulls given the confluence with the rising trendline in that area.
- Trendline Breakdown and Return to the Base (Risk Case) — A decisive close below the rising blue trendline and the 0.785 level would raise the risk of a full retracement back toward the 1.0 Fibonacci level at $63.87 and the prior consolidation zone (gray shaded area), effectively erasing the entire May-June advance and suggesting the breakout was a failed move.
Conclusion
AST SpaceMobile's sharp bounce off the 0.62 Fibonacci retracement and the long-term rising trendline marks an important test following one of the most explosive rallies on the chart — a move that took price from roughly $64 to $135 in just five weeks before reversing hard. Today's recovery, combined with RSI reclaiming the signal line from the mid-40s, is an encouraging early sign that the retracement may be stabilizing at this multi-factor support confluence. However, with both EMAs still pointed lower and price yet to reclaim either moving average, confirmation requires a sustained hold above $83-$89 and a recovery above the EMAs in the $95-$100 zone — without which, deeper tests of the $78.35 and even $63.87 levels remain on the table.


_06_12_2026_15_46_55_957007.jpg)

 Please wait processing your request...