
Key Highlights
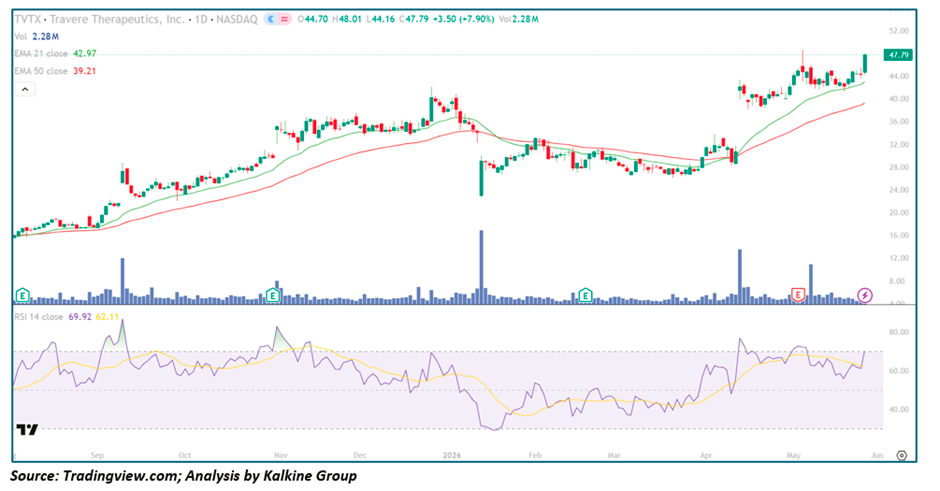
- TVTX closed at $47.79, surging +$3.50 (+7.90%) in a powerful breakout session
- Price traded between $44.16 and $48.01 intraday, closing near the absolute session high — a clear signal of sustained buying conviction throughout the day
- The stock trades firmly above EMA-21 ($42.97) and EMA-50 ($39.21), with both averages in strong bullish alignment confirming a fully restored uptrend structure
- RSI-14 closed at 69.92 (signal at 62.11), approaching overbought territory while retaining meaningful room to run — the ideal momentum configuration
- Volume at 2.28M surged materially, validating the breakout with strong institutional participation
- TVTX has advanced from sub-$18 lows in August 2025 to current highs near $48 — a gain of over 165% across the visible chart period
- Today's session marks a decisive new multi-month closing high, with price now challenging the upper boundary of the entire chart range
Trend Structure: From Early-Stage Breakout to Mature Multi-Phase Uptrend
Phase 1 — Base Breakout &Amp; Initial Trend Ignition (Aug – Oct 2025)
Travere Therapeutics entered the visible chart period already showing the early signs of a significant trend change:
- Price surged from sub-$18 lows in August on a massive Earnings-driven volume spike — one of the largest single sessions in the chart history
- EMA-21 and EMA-50 both turned sharply higher from this point, establishing early bullish alignment
- RSI spiked toward 80 on the initial breakout before settling into a constructive 60–70 range as the trend matured
- Price advanced steadily from the $18 breakout into the mid-$30s by October, carving out consistent higher highs and higher lows
- Each minor pullback during this phase was shallow and quickly absorbed by buyers re-entering the trend at better prices
The August earnings catalyst proved to be the defining trigger for what became a multi-phase, institutionally-driven uptrend that has persisted for the better part of a year.
Phase 2 — Extended Consolidation & Trend Digestion (Nov 2025 – Jan 2026)
Following the initial explosive advance, TVTX entered a more volatile but ultimately constructive digestion phase:
- Price peaked near $37–$38 in late November before entering a multi-week consolidation between roughly $30 and $37
- The November earnings event triggered a brief acceleration followed by an orderly pullback — textbook healthy trend behaviour
- EMA-21 and EMA-50 continued rising throughout this phase despite price Volatility, confirming the underlying trend remained structurally intact
- RSI oscillated between 45 and 72, repeatedly resetting without sustaining a breakdown below the neutral 50 level
- The January 2026 event triggered a sharp single-session spike low into the mid-$20s on extraordinary volume — a classic shakeout of weak hands before a powerful recovery
Critically, despite the January volatility event, the stock never closed decisively below the rising EMA-50, and buyers stepped in immediately to defend the broader trend structure.
Phase 3 — Recovery Base, Golden Cross Confirmation & Parabolic Acceleration (Feb – May 2026)
From the January 2026 volatility lows, TVTX has executed a methodical and increasingly powerful recovery sequence:
- Price stabilised in the $28–$32 range through February and March as the base was rebuilt
- EMA-21 crossed above EMA-50 in a confirmed golden cross during March — a major structural signal of medium-term bullish trend resumption
- From April onward, the pace of advance accelerated sharply, with price breaking above $35, $40, and now $48 in rapid succession
- The April earnings event provided another significant volume catalyst, driving the next leg higher with institutional conviction
- Today's +7.90% session on 2.28M volume represents the most powerful single-day advance since the initial August 2025 breakout — confirming that fresh institutional Capital is aggressively entering the position
The overall structure across all three phases describes a stock in the early-to-middle stages of a major institutional re-rating, with each correction serving as an accumulation opportunity rather than a trend-ending event.
Moving Averages: Golden Cross Structure Powers Accelerating Bullish Trend
EMA-21 ($42.97)
- Price trades $4.82 above this level following today's breakout session — a healthy and expanding separation
- The EMA-21 has been rising steeply since March, reflecting the accelerating pace of the most recent trend leg
- Previous tests of the EMA-21 throughout the trend have consistently attracted aggressive dip-buying, confirming it as a reliable dynamic support level
- Current positioning comfortably above the EMA-21 keeps near-term bulls firmly in control of the daily trend structure
EMA-50 ($39.21)
- The EMA-50 has maintained a powerful upward slope throughout the entire recovery from the January lows — one of the clearest signs of institutional sponsorship
- Price trades $8.58 above this level, reflecting the healthy and expanding gap that characterises strong momentum trends
- The confirmed golden cross — EMA-21 above EMA-50 in rising alignment — provides the most powerful medium-term technical endorsement available on the Daily Chart
- A sustained hold above the EMA-50 at $39.21 preserves the full bullish thesis and defines the line in the sand for medium-term trend continuation
The widening separation between both rising moving averages and current price reflects a trend that is not decelerating but actively accelerating — a rare and highly bullish technical configuration in the current biotech landscape.
Momentum Analysis: RSI Approaches Overbought in the Ideal Momentum Configuration
RSI-14 at 69.92 with the signal line at 62.11 places TVTX at the doorstep of overbought territory — the single most constructive RSI positioning for continuation momentum plays.
Current RSI behaviour indicates:
- At 69.92, the RSI is approaching but has not yet exceeded the 70 overbought threshold — meaning momentum is strong but not yet technically exhausted
- The RSI line trading well above its signal at 62.11 confirms that momentum is actively accelerating rather than plateauing
- Prior RSI peaks in the trend (the August 2025 breakout and the November rally) both reached above 70 before any meaningful consolidation occurred — suggesting today's reading leaves additional near-term upside available
- The RSI recovery from the extended sub-50 readings of February and March represents a complete momentum restoration — a journey from trend doubt back to trend Leadership
- Historically throughout this chart, RSI readings in the 65–75 range have consistently preceded the strongest price advances, not their termination
The current RSI configuration — accelerating toward but not yet through overbought — is arguably the single most favourable momentum setup for short-to-medium term continuation trades.
Volume Analysis: Three Institutional Catalysts, One Consistent Accumulation Theme
The volume profile across the full chart period reveals a clear pattern of repeated institutional engagement at key inflection points:
- The August 2025 earnings spike generated the largest volume event in the chart — the initial institutional ignition that launched the entire trend
- The January 2026 volatility event produced another extraordinary volume spike that marked the final Capitulation of sellers and the entry point for new institutional buyers
- The April 2026 earnings event delivered another significant volume surge, confirming re-engagement at a critical recovery juncture
- Today's 2.28M session on a close-at-high breakout day confirms that the most recent catalyst is attracting fresh and substantial institutional participation
- Throughout the consolidation phases between these events, volume declined appropriately — the classic pattern of institutional accumulation interspersed with low-activity digestion periods
Each major volume event in this chart has ultimately proven to be a bullish inflection point, and today's session fits squarely within that pattern.
Key Technical Levels
Resistance Levels
- $48.00–$48.50 — immediate resistance at today's breakout high
- $50.00 — major psychological resistance and next round-number target
- $52.00–$54.00 — technical extension target if $50 breakout momentum accelerates
Support Levels
- $42.97–$43.50 — EMA-21 and immediate short-term trend support
- $39.00–$39.21 — EMA-50 and primary medium-term structural support
- $34.00–$35.00 — prior breakout consolidation zone and deeper support
- $28.00–$30.00 — major structural support from the January–February recovery base
Scenario Analysis
- Bullish Continuation (Primary Case)
If TVTX sustains above EMA-21 near $42.97 following any near-term consolidation: → Momentum could continue expanding toward the $50 psychological target and beyond → A decisive close above $48.50 would confirm the breakout and open the path toward $52–$54 → Continued progress in rare disease pipeline development and commercial execution could sustain and amplify the institutional re-rating already underway
- Sideways Consolidation (Constructive Outcome)
Following today's powerful +7.90% session, a brief consolidation near the $44–$48 zone would be entirely healthy: → RSI retreats gradually from near-overbought levels while price holds the breakout zone → EMA-21 continues its steep ascent beneath current price, providing a rising floor for any consolidation → A tight consolidation above $44 would strengthen the technical foundation for a clean continuation breakout toward $50+
- Bearish Breakdown (Risk Case)
A Reversal back below EMA-50 near $39.21 would weaken the near-term bullish setup materially: → Downside risk could expand toward the $34–$35 prior consolidation support zone → RSI would likely deteriorate back below the neutral 50 level, signalling meaningful momentum failure → However, given the quality of the golden cross structure and today's strong institutional volume confirmation, this scenario represents a distinctly lower-probability outcome at this time
Conclusion: TVTX Delivers a Textbook Multi-Phase Institutional Uptrend With Fresh Breakout Momentum
Travere Therapeutics has constructed one of the most technically coherent bullish trend stories in the current biotech space — advancing over 165% from its August 2025 lows across multiple distinct phases, each supported by genuine institutional volume, confirmed moving-average structure, and disciplined RSI momentum behaviour. Today's +7.90% breakout to multi-month highs, closing near the absolute session high on 2.28M volume, represents not the exhaustion of this trend but its latest and most powerful confirmation.
The framework moving forward remains clear:
- Above EMA-21 at $42.97 → bullish momentum remains fully intact and continuation toward $50+ is the primary scenario
- Above $48.50 → breakout confirmation strengthens significantly and a challenge of the $52–$54 extension target becomes increasingly viable
- Below EMA-50 at $39.21 → caution increases materially and medium-term trend reassessment is warranted
For momentum-focused biotech investors, TVTX currently offers a rare combination of mature trend structure, fresh breakout momentum, institutional volume confirmation, and a near-overbought RSI that has historically preceded — rather than terminated — the strongest advances in this stock's chart history.


 Please wait processing your request...