
Key Highlights
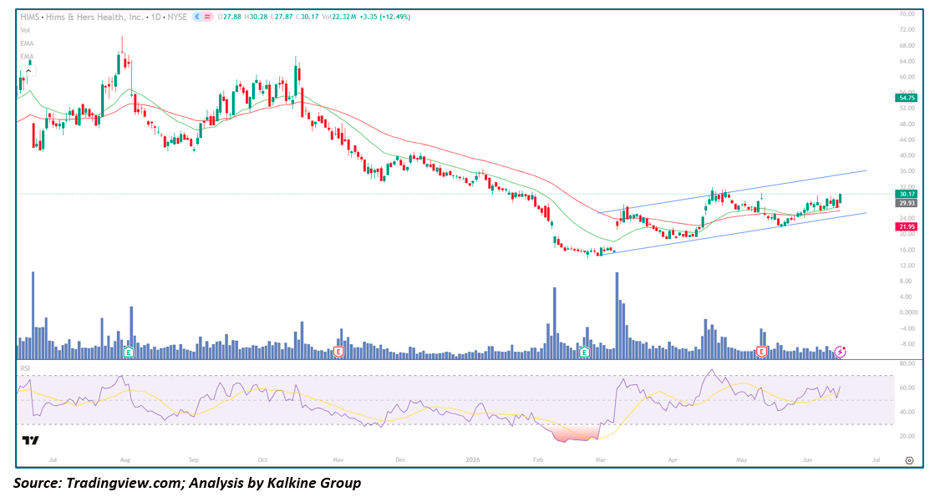
- HIMS closed at $30.17, up +$3.35 (+12.49%) on volume of 22.32M shares, with an intraday range of $27.87-$30.28, marking one of the strongest single-session gains since the recovery began in late February
- The stock has staged a major recovery from the cycle low near $16 in late February/early March to today's close of $30.17 — a gain of nearly 90% — after a prolonged decline from the October 2025 peak near $65
- Price is climbing within a well-defined ascending channel (blue trendlines) that began forming in early March, with today's surge pushing price toward the upper boundary of this channel
- RSI-14 has recovered from deeply oversold territory below 20 in late February/early March (the most extreme oversold reading on the chart) to approximately 60 today, reflecting a sustained momentum turnaround over the past several months
- Both EMAs (green and red) have flattened and turned higher since March, with price now trading above both moving averages, consistent with the early-to-middle stages of a new uptrend
- Today's volume spike of 22.32M shares is among the largest on the chart outside of the late-February capitulation period, suggesting strong participation behind the breakout move
Trend Structure: A Year-Long Round Trip From Summer Highs to a February Capitulation, Now Building a New Uptrend
Phase 1 — Choppy Range Trading at Elevated Levels (Jun – Aug 2025)
HIMS began the period trading in a volatile range roughly between $40 and $70, with sharp single-session moves in both directions and RSI oscillating widely without sustained directional conviction. A notable spike to the high-$60s in early August was followed by a swift reversal, with both EMAs running close together and crossing repeatedly — characteristic of a market in transition rather than a clear trend.
Phase 2 — Renewed Advance to the October Peak (Sep – Oct 2025)
From a local low near $43 in early September, price advanced steadily through September and into October, reaching a cycle high near $65 in mid-October. RSI pushed toward 60-65 during this advance, with the green EMA providing support on pullbacks. This marked the last significant high on the chart before the extended decline that followed.
Phase 3 — Sustained Decline Through Year-End (Oct 2025 – Jan 2026)
From the October peak, HIMS entered a prolonged and steady downtrend, declining from ~$65 toward the high-$20s/low-$30s by January 2026. RSI spent extended periods in the 30-50 range during this decline, with both EMAs sloping persistently downward and price consistently trading below both moving averages — a textbook sustained downtrend with few meaningful counter-trend bounces.
Phase 4 — Capitulation to the Cycle Low (Jan – Mar 2026)
The decline accelerated sharply in late January and February, taking price from the high-$20s down to a cycle low near $16 by early March. RSI dropped below 20 during this period — the most extreme oversold reading on the entire chart, signaling capitulation-level selling. Volume spiked notably during this final leg down, consistent with a climactic sell-off rather than an orderly decline.
Phase 5 — Base Formation and Channel Breakout (Mar – Apr 2026)
From the ~$16 low, price began forming a base, with the ascending channel (blue trendlines) starting to take shape from early March. A sharp rally in late March/early April pushed price from the low-$20s toward $30-$32, with RSI surging from oversold levels back above 70 — the strongest momentum reading since the October 2025 peak. Both EMAs turned higher during this phase, beginning to track the new uptrend.
Phase 6 — Channel Consolidation (Apr – Jun 2026)
Through April, May, and into June, price has consolidated within the ascending channel, oscillating between the lower and middle portions of the channel roughly in the $22-$30 range. RSI cooled from the April overbought reading back toward 40-50 during this consolidation, with both EMAs flattening as price digested the prior advance while maintaining the broader higher-low structure defined by the channel's lower boundary.
Phase 7 — Breakout Toward the Channel's Upper Boundary (Mid-Jun 2026)
Today's +12.49% surge represents the strongest single-day move since the initial April rally off the lows, pushing price from the $27-$28 area to $30.17 and bringing it into proximity with the upper boundary of the ascending channel. RSI's move toward 60 reflects renewed momentum, though it remains below the overbought extremes seen at the April peak.
Moving Averages: EMAs Aligned Higher, Confirming the New Uptrend Structure
Both the green and red EMAs have been sloping gently higher since the March lows, with price now trading above both — a marked change from the persistent downtrend structure of Phase 3, where price remained below both moving averages for months. Today's rally extends this separation further. A continued hold above both EMAs, with the moving averages maintaining their upward slope, would reinforce the case that the broader trend has shifted from bearish to bullish following the February capitulation.
Momentum Analysis: RSI Recovers Toward 60, Building on a Multi-Month Uptrend in Momentum
RSI-14's gradual climb from sub-20 oversold extremes in late February to approximately 60 today reflects one of the most significant momentum turnarounds on the chart, occurring over several months rather than in a single sharp spike. The RSI has crossed back above its signal line (yellow) with today's move, and remains below the 70-80 overbought zone reached briefly in early April — leaving some room for continuation before momentum becomes stretched, provided the advance doesn't accelerate too quickly from here.
Key Technical Levels
Resistance Levels
- $32.00 — upper boundary of the ascending channel near current levels and a prior local high from April
- $36.00 — projected upper channel resistance further out, based on the channel's slope
- $43.00-$48.00 — major horizontal resistance from the September 2025 base and the lower portion of the late-2025 decline
- $65.00 — cycle high from October 2025 and a distant longer-term target
Support Levels
- $27.00-$28.00 — near-term support from today's breakout origin and the middle of the recent consolidation
- $24.00-$25.00 — lower-channel support and the consolidation floor from April-May
- $20.00-$22.00 — lower boundary of the ascending channel near current levels
- $16.00 — cycle low from late February/early March; a return here would represent a failure of the entire recovery
Scenario Analysis
- Bullish Channel Breakout (Constructive Case) — If HIMS closes above the upper channel boundary near $32 with RSI continuing to build toward 65-70, price could see a re-rating move toward $36 and potentially open a path back toward the $43-$48 zone over a longer timeframe, as the stock transitions from a basing/recovery pattern toward a renewed uptrend.
- Channel Continuation (Base Case) — A more measured outcome would see price consolidate near the upper channel boundary, pulling back toward the channel midline ($26-$28) before resuming higher, consistent with the stair-step pattern that has characterized the recovery since March. This would represent healthy digestion of today's sharp gain.
- Channel Breakdown (Bearish Case) — A reversal back below the lower channel boundary (currently near $22-$24 and rising) would call into question the integrity of the ascending channel structure built since March, opening the path toward a retest of the $20 zone and raising concerns about whether the recovery from the February lows has stalled.
Conclusion
Hims & Hers' powerful +12.49% surge on strong volume marks a potential acceleration within an already-established recovery uptrend that has taken the stock from a capitulation low near $16 to today's close of $30.17 — a gain of nearly 90% over roughly three and a half months. With both EMAs sloping higher, price trading above both, and RSI building toward 60 within an ascending channel, the technical structure remains constructive. However, with price now approaching the upper boundary of the channel near $32, the next few sessions will be important: a clean breakout above this level with sustained volume would suggest the recovery is entering a new, more aggressive phase, while a pullback toward the channel midline would represent a more typical consolidation within the existing uptrend.


 Please wait processing your request...