Key Highlights
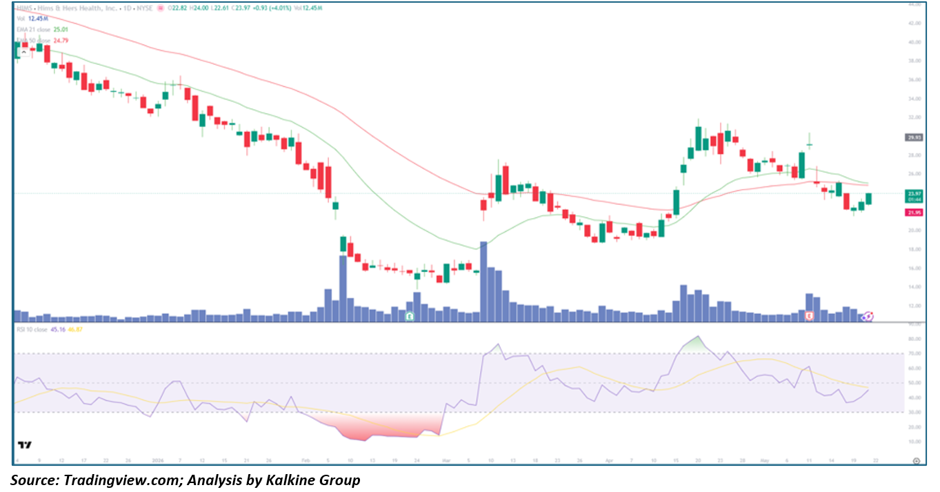
- HIMS closed at 23.97, gaining +4.01% in the latest session
• Price traded between 22.61 and 24.00 intraday, reflecting renewed buying activity
• The stock is currently positioned near the EMA-21 (25.01) and EMA-50 (24.79), signaling improving technical balance
• RSI-10 recovered to 45.16 after previously falling into deeply oversold territory below 30
• Multiple high-Volume Reversal sessions during February and March suggest institutional accumulation activity
• The stock has rebounded sharply from the February Capitulation lows near 19
• Current price action reflects consolidation and potential early-stage recovery formation rather than continued breakdown
Trend Structure: From Momentum Collapse to Recovery Stabilization
Phase 1 — Distribution & Downtrend Acceleration (Dec 2025 – Feb 2026)
HIMS entered a prolonged bearish phase after failing to sustain prior highs near the $40 region.
During this decline:
- Lower highs and lower lows developed consistently
• EMA-21 remained below price resistance throughout the decline
• Selling pressure intensified across multiple breakdown candles
• Momentum deteriorated steadily as RSI repeatedly failed near the midpoint
The decline eventually accelerated into a capitulation-style washout near the $19 zone.
Phase 2 — Capitulation & Institutional Reversal Signals (Feb – Mar 2026)
The technical character of the stock began changing meaningfully during February and March.
Important developments included:
- Large-volume reversal candles emerging near the lows
• Sharp intraday recoveries after heavy selling pressure
• RSI rebounding aggressively from deeply oversold conditions
• Volatility compression after the panic phase stabilized
Most importantly, these reversal sessions occurred on substantially elevated volume, often a sign that institutional buyers may be accumulating shares during periods of forced Liquidation.
Rather than continuing lower, HIMS began forming a stabilization base.
Phase 3 — Recovery Rally & Base Construction (Apr – May 2026)
The current structure reflects a developing recovery attempt.
HIMS has now:
- Reclaimed the EMA-50 region after months below it
• Stabilized above the February lows
• Begun forming higher lows across recent weeks
• Entered a sideways consolidation range rather than resuming the downtrend
Although momentum remains moderate rather than explosive, the stock’s behavior has improved materially compared with the persistent weakness seen earlier this year.
Moving Averages: Potential Bullish Crossover Developing
The Moving Average structure is beginning to improve significantly.
EMA-21 (25.01)
- Recently flattened after a prolonged decline
• Beginning to stabilize near current price
• Could become short-term resistance initially
EMA-50 (24.79)
- Now converging with the EMA-21
• Reflects improving medium-term trend stability
• A bullish crossover would strengthen the reversal thesis materially
The narrowing gap between the moving averages suggests bearish momentum is fading and trend equilibrium is returning.
Momentum Analysis: RSI Recovery Signals Improving Conditions
RSI-10 currently sits near 45.16 after recovering sharply from deeply oversold conditions earlier this year.
This recovery is technically important because:
- RSI has escaped prolonged bearish territory
• Momentum deterioration has slowed substantially
• A move above the 50 midpoint would indicate improving bullish control
Historically, recovering Growth Stocks that reclaim and sustain RSI above 50 after major drawdowns often transition into durable recovery cycles rather than temporary relief rallies.
At present, momentum remains neutral-to-improving rather than fully bullish.
Volume Analysis: Accumulation Signals Emerging
Volume behavior during the recovery phase has become increasingly constructive.
Key observations:
- February and March reversal candles occurred on unusually strong volume
• Recent pullbacks have generally shown lighter participation
• Volume spikes aligned with rebound attempts rather than breakdown continuation
This type of activity often suggests:
- Institutional accumulation
• Reduced forced selling pressure
• Stabilization following capitulation
While speculative volatility remains elevated, aggressive distribution behavior appears to have eased considerably.
Key Technical Levels
Resistance Levels
- 25–26 — immediate moving-average resistance zone
• 28–30 — prior recovery highs
• 34–36 — major medium-term resistance region
Support Levels
- 22–23 — near-term support zone
• 19–20 — major capitulation low support
• Below 19 — would invalidate much of the recovery structure
Scenario Analysis
- Bullish Recovery Continuation (Primary Recovery Case)
If HIMS successfully reclaims and holds above the EMA resistance zone near 25–26:
→ Momentum could improve toward 28–30
→ RSI may reclaim the bullish midpoint above 50
→ The stock could transition into a broader multi-month recovery trend
- Consolidation & Base Formation (Healthy Outcome)
The stock may continue consolidating sideways:
→ Trading range between 22–26
→ Moving averages flatten further
→ RSI stabilizes near neutral territory
This would help strengthen the longer-term recovery structure.
- Bearish Failure (Risk Case)
A breakdown below the 22–20 support zone could weaken the recovery thesis:
→ Selling pressure may re-emerge aggressively
→ Capitulation lows near 19 could be retested
→ Trend reversal expectations would deteriorate materially
Currently, this remains a secondary scenario unless volume expands sharply on downside moves.
Conclusion: Early Signs of a Technical Recovery Are Emerging
Hims & Hers Health is no longer behaving like a stock trapped in a persistent momentum collapse.
Instead, the current technical structure increasingly reflects:
- Stabilization above capitulation lows
• Improving moving-average alignment
• Recovery in momentum indicators
• Institutional-style reversal volume
• Early-stage base construction behavior
The framework moving forward is becoming clearer:
- Above 25–26 → recovery momentum strengthens
• Above 30 → broader trend reversal gains credibility
• Below 22 → caution increases materially
While HIMS has not yet fully confirmed a complete bullish trend reversal, the stock appears to be transitioning away from pure downside momentum and into the early stages of a potentially durable recovery cycle.


 Please wait processing your request...