
 CA
 NZ
 UK
 AU
 IND

 US

 Share
 X (Formerly Twitter)
 Whatsapp
 Facebook
 LinkedIn
 Telegram
 Email This Article
 Copy Link
 Summarize with AI
 Chat GPT
 Perplexity

Today's session produced a sweeping rally across genomics, medical-device, data-security, and healthcare-services names. 10x Genomics ( Nasdaq : TXG) surged nearly 13%, Butterfly Network (NYSE: BFLY), Rubrik (NYSE: RBRK), and LifeStance Health (NASDAQ: LFST) all gained more than 10%, and RadNet (NASDAQ: RDNT) added a further 6.79%. Volume was heavy across the group, with several names breaking decisively to fresh highs after multi-month uptrends or basing patterns.
10x Genomics, Inc. (NASDAQ: TXG) — Explosive Breakout to Fresh Highs
Key Highlights
- TXG trading at $58.69, up 12.79% ($6.66) on volume of 3.17M shares, after ranging between $50.81 and $59.00 on an open at $51.91.
- Price has surged well above both the 20-day EMA ($47.02) and the 50-day EMA ($40.57), extending a powerful uptrend to new highs.
- RSI has spiked to roughly 75.30, with the signal line at 65.86 — a move deep into overbought territory.
- TXG spent late 2025 basing in the mid-teens, then climbed steadily through a choppy 2026 range between roughly $18 and $28 before an accelerating breakout from May onward carried the stock to today's fresh highs.
- Today's gain is the largest single-day move on the chart since the uptrend began accelerating in May.
Trend Structure TXG's chart shows a long, quiet base through late 2025, followed by a gradual climb through a choppy range in early 2026. From May onward the stock has been in a steady, accelerating uptrend, and today's session extends that move to fresh highs on the heaviest conviction yet. 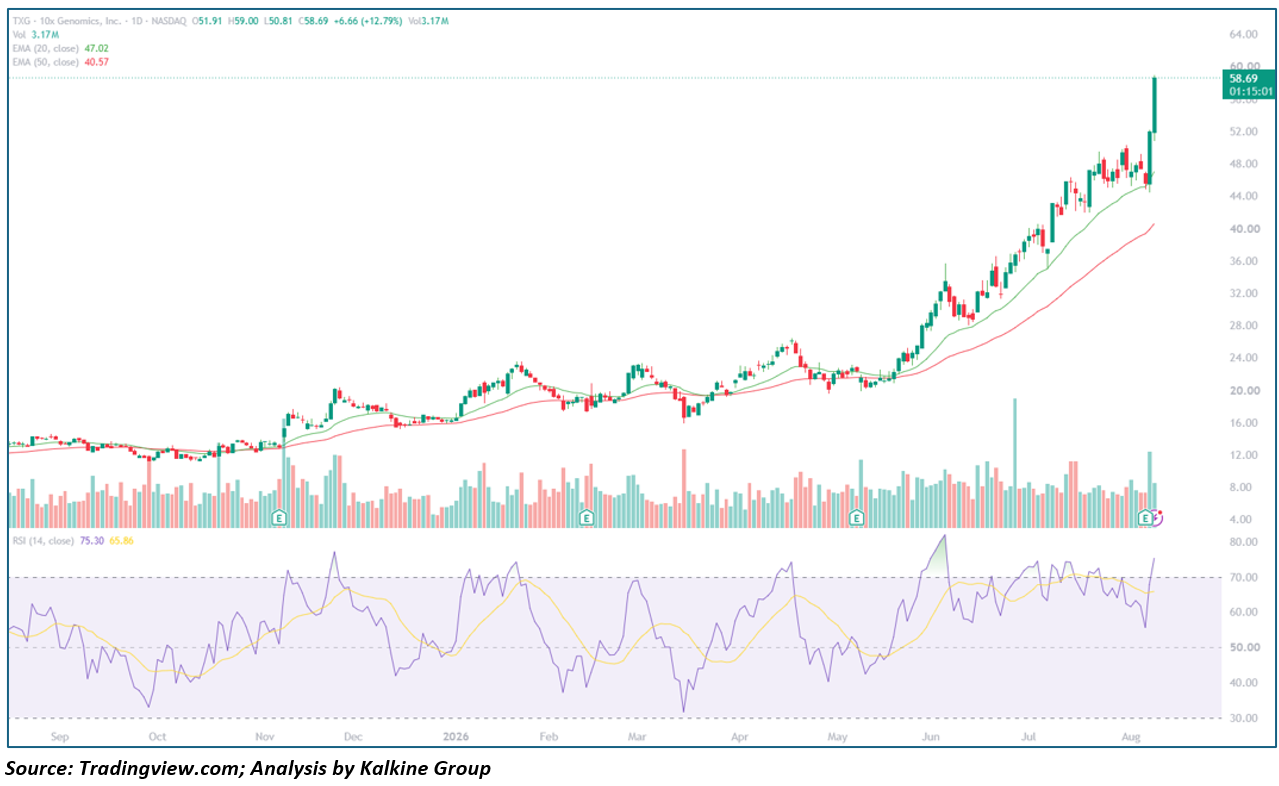
Key Technical Levels Resistance
- ~$60.00 – Psychological round-number level / today's high area
- No prior chart resistance meaningfully overhead; the stock is testing new highs
Support
- $47.02 – 20-day EMA
- ~$50.00 – Recent breakout shelf
- $40.57 – 50-day EMA
Outlook TXG's breakout is a decisive technical development, and the stock remains well above both EMAs after a sustained multi-month climb. The deeply overbought RSI raises the risk of near-term consolidation; holding above $50 on any pullback would keep the uptrend intact.
Butterfly Network, Inc. (NYSE: BFLY) — Fresh Highs on a Persistent Multi-Month Climb
Key Highlights
- BFLY trading at $9.79, up 10.82% ($0.96) on volume of 8.76M shares, after ranging between $8.83 and $10.05 on an open at $8.84.
- Price has extended well above both the 20-day EMA ($7.90) and the 50-day EMA ($7.07), continuing a steady uptrend that has been in place for months.
- RSI has climbed to roughly 67.17, with the signal line at 55.16 — a firm move into bullish territory.
- BFLY rallied steadily from roughly $2 in late 2025 to a June 2026 spike near $9.50, corrected into a July low near $7, and has since recovered to press to fresh highs today.
- Today's gain is among the largest single-day moves on the chart since the June spike.
Trend Structure BFLY's chart shows a persistent, well-supported uptrend from late 2025 through mid-2026, punctuated by a sharp June spike and a subsequent pullback. Today's session breaks the stock out to fresh highs, extending the underlying uptrend. 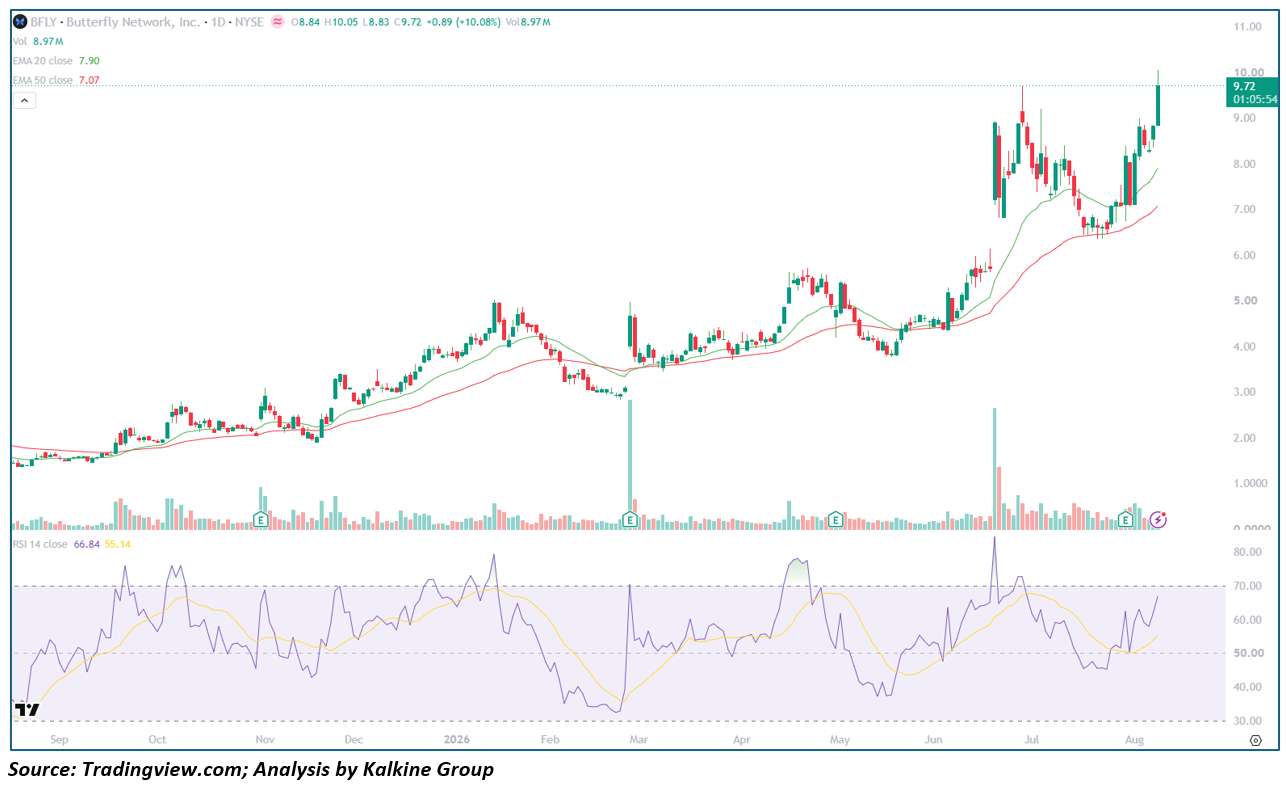
Key Technical Levels Resistance
- ~$10.00 – Psychological round-number level / today's high area
- No prior chart resistance meaningfully overhead; the stock is testing new highs
Support
- $7.90 – 20-day EMA
- ~$8.00 – Recent breakout shelf
- $7.07 – 50-day EMA
Outlook BFLY's breakout to fresh highs keeps the multi-month uptrend intact. Holding above $8 on any pullback would confirm the move has staying power; a fade back into the summer range would suggest today's gain needs more time to be digested.
Rubrik, Inc. (NYSE: RBRK) — Sharp Breakout Above a Multi-Month Recovery Range
Key Highlights
- RBRK trading at $99.79, up 10.79% ($9.72) on volume of 3.74M shares, after ranging between $90.00 and $99.93 on an open at $90.82.
- Price has surged well above both the 20-day EMA ($80.86) and the 50-day EMA ($76.33), clearing the top of a range that had capped the stock since June.
- RSI has spiked to roughly 76.30, with the signal line at 51.33 — a sharp move deep into overbought territory.
- RBRK declined from a September 2025 high near $105 into a February 2026 low near $48, then staged a steady recovery through the spring and summer, consolidating in a roughly $75-$90 range before today's decisive breakout.
- Today's gain is the largest single-day move on the chart since the February low.
Trend Structure RBRK's chart shows a sustained decline from a September 2025 peak into a February 2026 low, followed by a steady, well-supported recovery through the spring and summer. Today's session clears the top of a multi-month consolidation range on heavy volume. 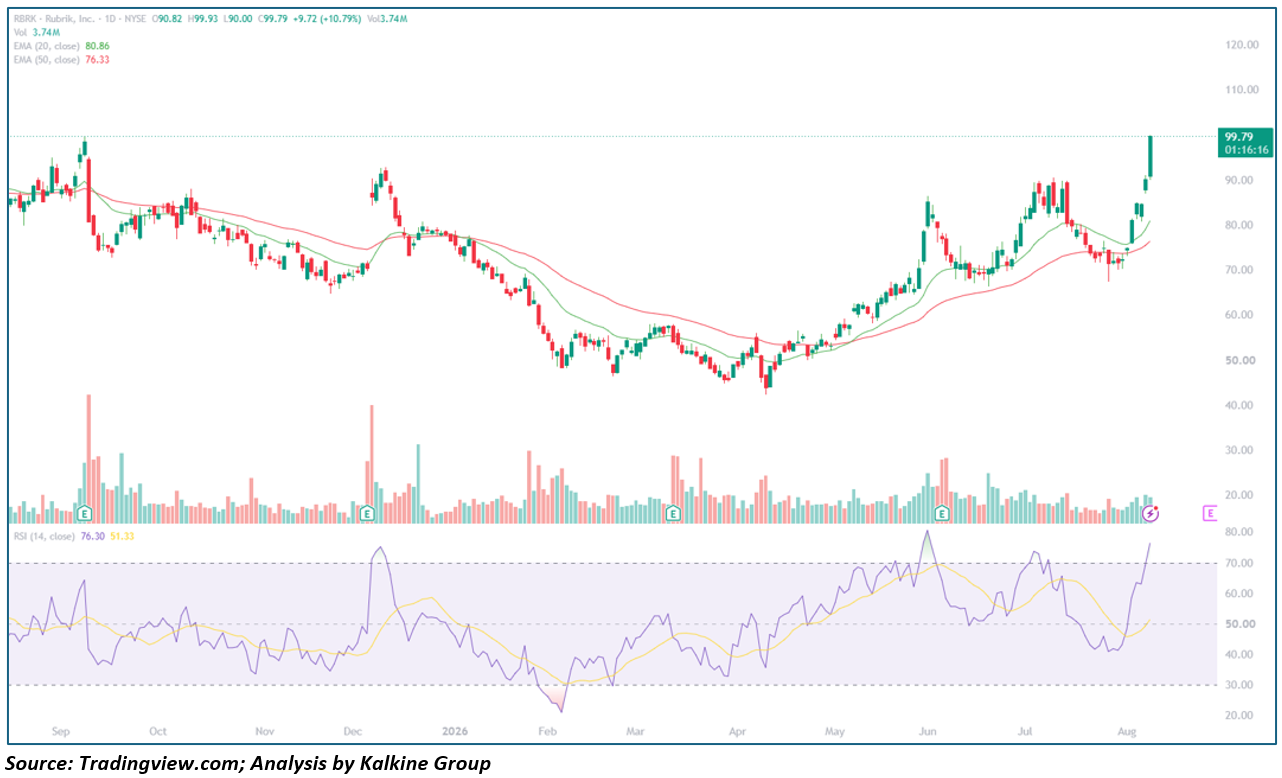
Key Technical Levels Resistance
- ~$100.00 – Psychological round-number level / today's high area
- No prior chart resistance meaningfully overhead beyond that level
Support
- $80.86 – 20-day EMA
- ~$88.00 – Top of the recent range (former resistance, now support)
- $76.33 – 50-day EMA
Outlook RBRK's breakout is a decisive technical development after a long recovery process, though the extreme RSI reading raises the risk of near-term consolidation. A hold above $88 on any retest would confirm the breakout has staying power; a fast fade back into the prior range would suggest today's move needs more time to digest.
LifeStance Health Group, Inc. (NASDAQ: LFST) — Breaking Out of a Summer Consolidation Range
Key Highlights
- LFST trading at $11.99, up 10.61% ($1.15) on volume of 8.06M shares, after ranging between $10.85 and $12.43 on an open at $10.85.
- Price has broken above both the 20-day EMA ($10.79) and the 50-day EMA ($10.04), clearing the top of a range that had contained the stock since June.
- RSI has climbed to roughly 68.28, with the signal line at 55.28 — a firm move into bullish territory.
- LFST rallied steadily from roughly $5 in late 2025 to a July 2026 high near $11.50, then consolidated in a roughly $10-$11.50 range before today's decisive breakout to fresh highs.
- Today's gain is among the largest single-day moves on the chart since the spring uptrend phase.
Trend Structure LFST's chart shows a steady, persistent uptrend from a late-2025 base through mid-2026, followed by a multi-week consolidation just below the July highs. Today's session clears that range on heavy volume, pushing the stock to fresh highs. 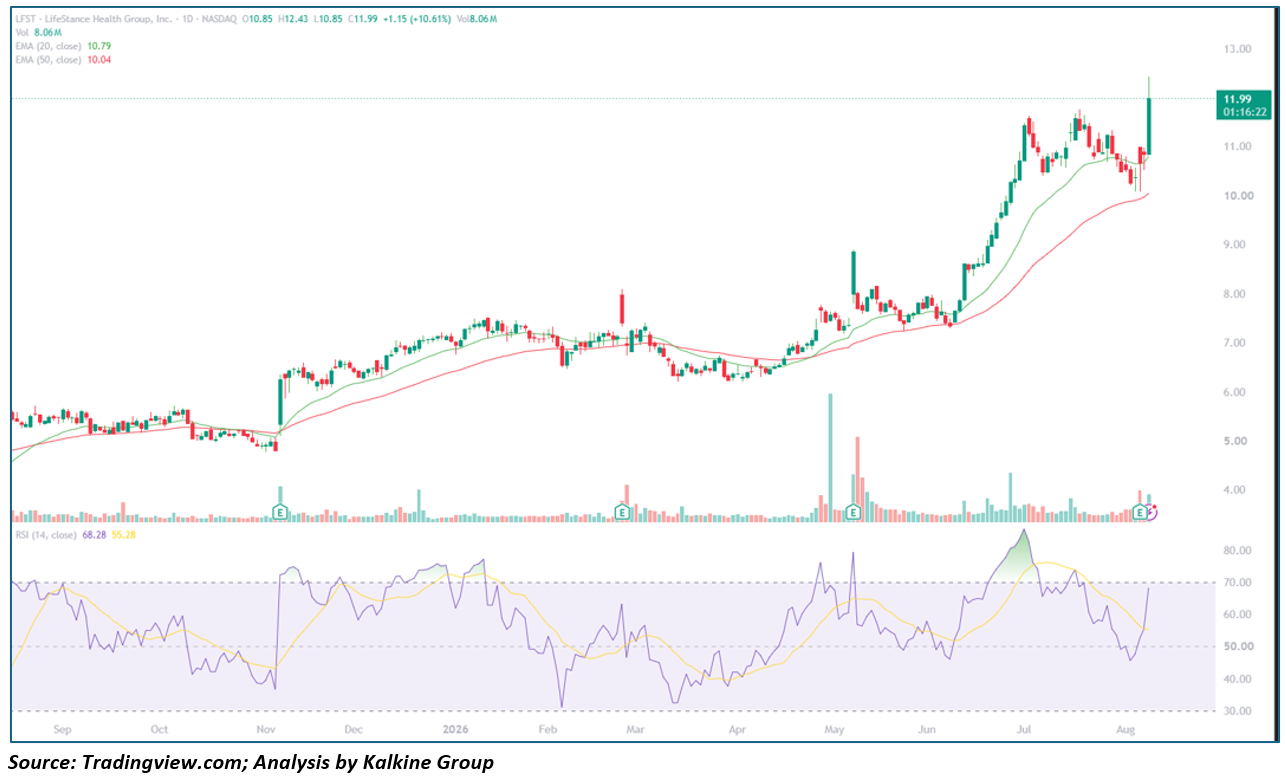
Key Technical Levels Resistance
- ~$12.50 – Today's intraday high area
- No prior chart resistance meaningfully overhead; the stock is testing new highs
Support
- $10.79 – 20-day EMA
- ~$11.00 – Top of the recent range (former resistance, now support)
- $10.04 – 50-day EMA
Outlook LFST's breakout clears a range that had constrained the stock for weeks. A hold above $11 on any retest would confirm the breakout has staying power; a fade back into the prior range would suggest today's move needs more time to be digested.
RadNet, Inc. (NASDAQ: RDNT) — Strong Recovery Approaching Late-2025 Highs
Key Highlights
- RDNT trading at $77.30, up 6.79% ($4.91) on volume of 1.1M shares, after ranging between $69.81 and $78.86 on an open at $73.03.
- Price has extended well above both the 20-day EMA ($66.04) and the 50-day EMA ($62.77), continuing a steady multi-month recovery.
- RSI has climbed to roughly 75.39, with the signal line at 58.32 — a sharp move deep into overbought territory.
- RDNT declined from a November 2025 high near $85 into an April 2026 low near $52, then staged a steady recovery through the summer that has accelerated over the past several sessions.
- Today's gain is among the largest single-day moves on the chart since the recovery began in April.
Trend Structure RDNT's chart shows a sustained decline from a November 2025 peak into an April 2026 low, followed by a gradual, choppy recovery that has picked up pace through July and August. Today's session extends that move to the stock's best levels since last November.
Key Technical Levels Resistance
- ~$80.00 – November 2025 high area
- ~$85.00 – November 2025 peak
Support
- $66.04 – 20-day EMA
- ~$70.00 – Recent breakout shelf
- $62.77 – 50-day EMA
Outlook RDNT's recovery is approaching a key test at the November 2025 highs, and the deeply overbought RSI raises the risk of a near-term pause. A close above $80 would open a path toward retesting the $85 peak; a fade back below $70 would suggest the rally needs more time to consolidate. 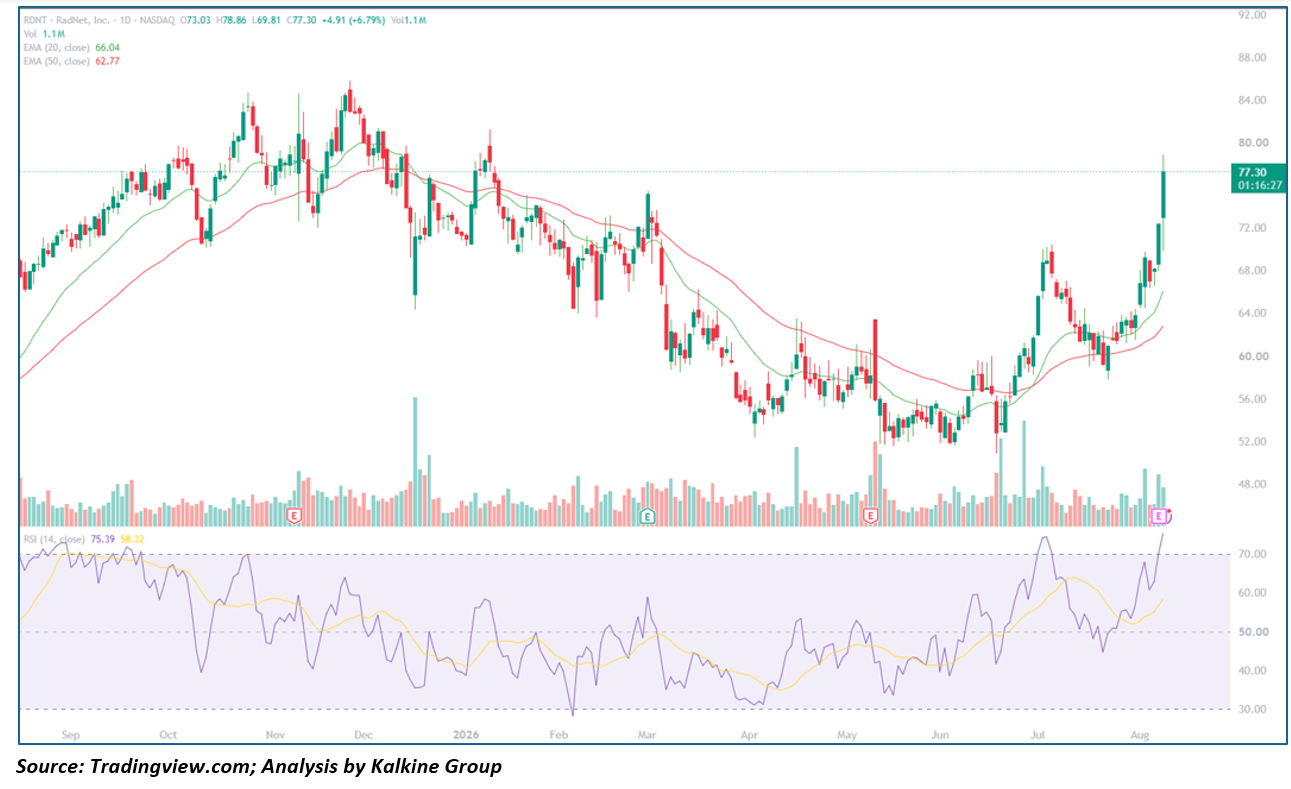
This analysis is based on Daily Chart technical indicators (20/50-day EMAs, RSI-14) and price action as of August 10, 2026, and is intended for informational purposes only — not Investment advice.


 Nov 20, 2026





 Please wait processing your request...