-Copy_05_27_2026_23_55_43_634079.jpg)
Key Highlights
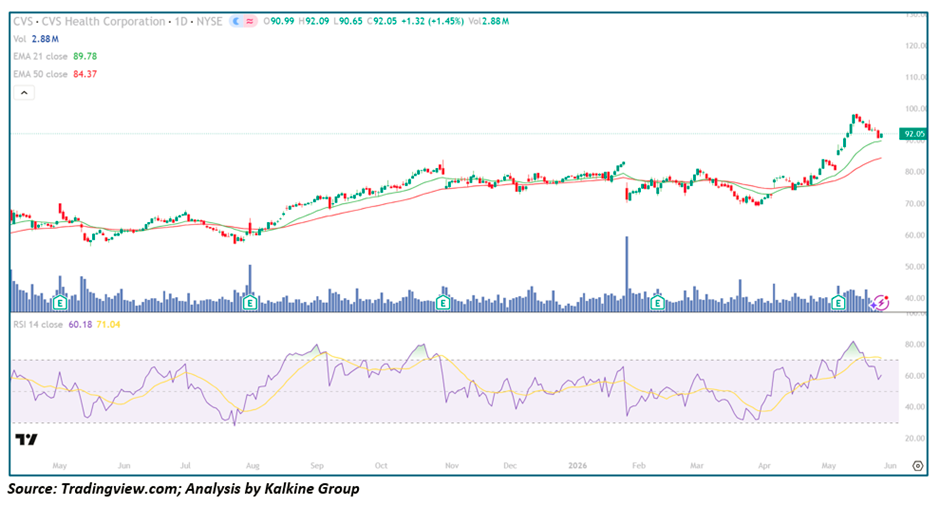
- CVS closed at $92.05, gaining +$1.32 (+1.45%) in a steady consolidation session following a major breakout
- Price traded between $90.65 and $92.09 intraday, reflecting controlled and orderly buying interest near recent highs
- The stock trades comfortably above EMA-21 ($89.78) and EMA-50 ($84.37), with both averages in strong rising alignment — confirming a fully intact bullish trend structure
- RSI-14 closed at 60.18 (signal at 71.04) — a notable bearish divergence between the RSI line and its signal, signalling that momentum is cooling constructively from overbought extremes following the recent spike
- Volume at 2.88M remains consistent and healthy, supporting the view of orderly institutional consolidation rather than distribution
- CVS has rallied from sub-$60 lows in July 2025 to current highs near $100 — an advance of over 65% across the full visible chart period
- Current price action reflects a healthy digestion of the extraordinary May 2026 breakout spike that drove CVS briefly toward $100 before a controlled pullback to current levels
Trend Structure: From Deep Value Base to Sustained Multi-Phase Institutional Uptrend
Phase 1 — Bottoming Process & Early Trend Recovery (May – Aug 2025)
CVS entered the visible chart period deep in a recovery phase following what appeared to be an extended period of structural weakness:
- Price oscillated in the $58–$68 range through May and June, with EMA-21 and EMA-50 running in close and bearish proximity
- The August Earnings event marked the first decisive inflection point — generating a significant volume spike and the initial thrust higher that would define the broader recovery
- RSI recovered from depressed sub-40 levels toward the 60–65 zone, confirming that the worst of the momentum deterioration had passed
- EMA-21 began crossing above EMA-50 in August, triggering the first golden cross of the recovery and establishing the foundational bullish alignment
- Higher lows became visible from August onward, a structural shift that confirmed buyers had regained control of the daily trend
This early recovery phase established the platform from which a much more powerful and sustained uptrend would develop over the following months.
Phase 2 — Trend Acceleration & Range Expansion (Sep – Dec 2025)
From the August base, CVS entered a materially stronger and more directionally consistent trend expansion phase:
- Price advanced from the $65–$68 recovery base into the $75–$80 range by November — a clean and steady uptrend with well-defined higher highs and higher lows
- EMA-21 maintained a healthy lead above EMA-50 throughout this period, confirming persistent short-term momentum advantage
- The November earnings catalyst generated another volume spike and brief acceleration before a natural consolidation period around the $78–$82 zone
- RSI reached overbought territory near 75–80 during the most powerful advance phases before naturally resetting — the healthy momentum oscillation pattern of a genuine institutional uptrend
- Volume remained constructively elevated during upside moves and declined appropriately during pullbacks — the textbook accumulation pattern
This phase transformed CVS from a recovery story into a genuine momentum leader within the healthcare and consumer staples space.
Phase 3 — Volatility, Recovery Base & Explosive Breakout (Jan – May 2026)
The final phase of the visible chart period delivered CVS's most dramatic price action — combining a sharp shock, a disciplined recovery, and an extraordinary breakout:
- The February 2026 earnings event triggered a violent single-session collapse into the low-$70s on the largest volume spike in the entire chart history — a severe negative earnings reaction that temporarily derailed the uptrend
- RSI plunged to near-35 oversold levels following this event, reflecting significant short-term momentum damage
- However, buyers stepped in rapidly and methodically — price recovered from the $70 shock lows back through $75, $80, and ultimately reclaimed EMA-21 within weeks
- March and April delivered a steady reconstruction of the bullish structure, with EMA-21 and EMA-50 resuming their upward slopes
- The May 2026 earnings event — the most recent catalyst — triggered an explosive breakout toward the $98–$100 zone on elevated volume, briefly taking CVS to its highest levels in the entire visible chart period
- The subsequent controlled pullback to the current $92 zone represents healthy post-breakout consolidation rather than trend Reversal
The ability of CVS to absorb a significant earnings shock in February and then rally to all-time chart highs by May is the defining characteristic of a stock under serious institutional sponsorship.
Moving Averages: Powerful Bullish Alignment Confirms Trend Maturity
EMA-21 ($89.78)
- Price trades $2.27 above this level — a tight and constructive spread reflecting healthy post-breakout consolidation
- The EMA-21 has been rising steeply throughout the recovery and breakout phases, confirming strong short-term momentum
- The proximity of current price to the EMA-21 suggests the stock is entering a natural digestion zone where the average will catch up beneath price — compressing the gap and strengthening the dynamic support floor
- A hold above the EMA-21 at $89.78 is the single most important near-term technical requirement for the continuation of the bullish thesis
EMA-50 ($84.37)
- The EMA-50 has maintained a powerful and uninterrupted upward slope since September 2025 — one of the longest sustained rising EMA-50 trends in the visible chart
- Price trades $7.68 above this level, reflecting healthy medium-term trend separation
- The consistent upward slope of the EMA-50 across multiple earnings events, market corrections, and volatility spikes confirms the depth and durability of the institutional buying programme behind CVS
- A sustained hold above the EMA-50 preserves the complete medium-term bullish thesis under virtually any near-term price scenario
The combination of both moving averages rising in parallel bullish alignment, with price trading above both, represents the most robust technical configuration available on the Daily Chart and confirms that the CVS uptrend remains structurally sound despite the recent post-breakout pullback.
Momentum Analysis: RSI Signals Healthy Cooling From Overbought Extremes
RSI-14 at 60.18 with the signal line at 71.04 reveals an important and instructive momentum dynamic following the May breakout spike:
Current RSI behaviour indicates:
- The RSI line at 60.18 has pulled back sharply from what was likely an 80+ reading during the peak of the May breakout surge — a healthy and entirely expected reset
- The signal line at 71.04, still elevated from the recent peak, now sits above the RSI line — creating a bearish crossover that signals short-term momentum is cooling
- This configuration is not a reversal signal but rather a digestion signal — consistent with the controlled pullback from $100 to $92 visible in the price action
- At 60.18, the RSI remains firmly above the neutral 50 level, confirming that the broader bullish momentum structure is intact despite the post-spike reset
- Historically throughout this chart, RSI resets from overbought back to the 55–65 zone have consistently marked entry points for the next leg of the CVS advance
The RSI signal line crossing above the RSI line is a near-term caution flag, but the absolute level of 60 — well above neutral and in bullish momentum territory — confirms this is consolidation within a healthy uptrend rather than the beginning of a structural reversal.
Volume Analysis: Earnings Events Consistently Drive Institutional Directional Commitment
CVS's volume profile across the full chart period reveals a consistent and compelling pattern of earnings-driven institutional engagement:
- Five distinct earnings events are visible on the chart, each generating a significant volume spike that served as a major directional catalyst
- The August 2025 and November 2025 earnings spikes both drove bullish continuation and trend acceleration
- The February 2026 earnings spike — the largest in the chart — triggered a sharp decline but was followed immediately by sustained recovery buying
- The May 2026 earnings spike drove the explosive breakout toward $100, confirming that the fundamental narrative has shifted decisively in favour of the bulls
- Baseline daily volume of around 2.88M remains consistently healthy, reflecting ongoing institutional interest between catalysts
- No signs of aggressive distribution into the current $92 consolidation zone are visible — sellers are not dominating the order flow at current prices
The repeated pattern of earnings volume spikes followed by sustained directional trend continuation confirms that CVS's institutional investors are managing positions around fundamental data points rather than trading on pure price momentum.
Key Technical Levels
Resistance Levels
- $92–$93 — immediate resistance at current consolidation highs
- $97–$100 — major resistance at the May 2026 breakout spike highs
- $100 — critical psychological resistance and all-time chart high zone
- $105–$110 — longer-term extension target if the $100 breakout is sustained
Support Levels
- $89–$90 — EMA-21 and immediate dynamic support — the most critical near-term level
- $84–$85 — EMA-50 and primary medium-term structural support
- $78–$80 — prior consolidation zone and meaningful intermediate support
- $70–$72 — major structural support at the February 2026 shock lows
Scenario Analysis
- Bullish Continuation (Primary Case)
If CVS holds above EMA-21 near $89.78 through the current consolidation phase: → A renewed advance toward the $97–$100 breakout highs becomes the primary technical target → A decisive and sustained close above $100 would represent a historic breakout of major psychological resistance and trigger fresh momentum inflows → Improving managed care dynamics, pharmacy benefit management tailwinds, and healthcare sector rotation could provide sustained fundamental support for the technical breakout
- Sideways Consolidation (Constructive Outcome)
Price may continue consolidating between $88 and $93 for several sessions or weeks: → RSI signal line gradually descends back toward the RSI line, resolving the current bearish crossover → EMA-21 rises to close the gap with current price, strengthening the dynamic support floor beneath the consolidation zone → A tight consolidation near the $90–$93 zone would build a powerful base for a cleaner and more sustained breakout above $100
- Bearish Breakdown (Risk Case)
A close below EMA-21 near $89.78 on elevated volume would raise near-term caution: → Downside risk could extend toward EMA-50 support near $84–$85 → RSI would likely break below the neutral 50 level, triggering additional momentum-based selling → However, given the strength of the broader uptrend, the quality of the May earnings catalyst, and the rising EMA-50 slope, this scenario represents the lower-probability outcome in the current technical environment
Conclusion: CVS Health Demonstrates the Resilience and Conviction of a World-Class Institutional Uptrend
CVS Health Corporation has delivered an extraordinary technical performance across the visible chart period — advancing over 65% from sub-$60 lows, absorbing a severe February 2026 earnings shock, and then staging an explosive May breakout toward the $100 psychological level. The stock's ability to repeatedly recover from adverse events and continue making higher highs is the defining characteristic of a stock under serious and sustained institutional sponsorship. The rising golden cross configuration, consistent earnings-volume engagement pattern, and current healthy post-breakout consolidation all combine to reinforce the view that this uptrend has significantly more room to run.
The framework moving forward remains clear:
- Above EMA-21 at $89.78 → bullish momentum remains fully intact and continuation toward $97–$100 is the primary scenario
- Above $100 → historic psychological breakout confirmed and extension toward $105–$110 becomes the medium-term target
- Below EMA-50 at $84.37 → caution increases significantly and a deeper consolidation phase becomes the more likely near-term outcome
For value-oriented momentum investors and healthcare sector allocators, CVS Health currently presents one of the most technically sound setups in the large-cap defensive growth universe — a stock that has demonstrated it can absorb adversity, recover with conviction, and challenge historic resistance levels with the full backing of institutional Capital.


 Please wait processing your request...