
Key Highlights
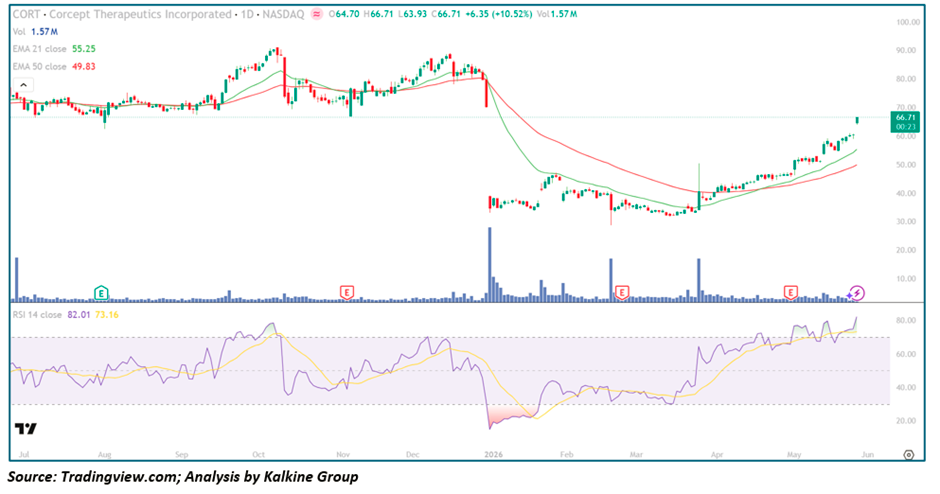
- CORT closed at $66.71, surging +$6.35 (+10.52%) in a powerful single-session breakout
- Price traded between $63.93 and $66.71 intraday, closing at the absolute high of the session — a sign of maximum bullish conviction
- The stock trades firmly above EMA-21 ($55.25) and EMA-50 ($49.83), confirming fully restored bullish trend structure
- RSI-14 closed at 82.01 (signal at 73.16), entering deep overbought territory — a hallmark of genuine momentum Leadership in high-conviction biotech moves
- Volume at 1.57M surged meaningfully, validating the breakout with institutional-level participation
- CORT has recovered dramatically from the catastrophic January 2026 crash lows near $32–$33 all the way back to $66.71 — effectively recouping the entire crash decline in under five months
- Today's close marks a decisive reclaim of the pre-crash price zone, representing one of the most technically significant sessions in the stock's recent history
Trend Structure: From Catastrophic Collapse to Full Bullish Restoration
Phase 1 — Stable Uptrend & Accumulation (Jul – Oct 2025)
Corcept Therapeutics entered the visible chart period with a quietly constructive bullish structure already in place:
- Price advanced steadily from the low-$60s toward the mid-$80s between July and October 2025
- EMA-21 and EMA-50 maintained healthy bullish alignment with price consistently trading above both averages
- Volume remained moderate and orderly, with the August Earnings event providing a brief but contained spike
- RSI climbed persistently from neutral levels into overbought territory near 75, confirming genuine momentum leadership
- The advance was characterised by steady higher highs and higher lows — a textbook healthy uptrend structure
This phase established CORT as a momentum leader in the biotech space, with institutional positioning building quietly beneath the surface of an apparently calm uptrend.
Phase 2 — Distribution, Peak & Catastrophic Crash (Nov 2025 – Jan 2026)
The November–January period delivered one of the most severe single-stock collapses visible anywhere in the broader market during this timeframe:
- Price peaked near the $82–$85 region in November 2025 before showing early signs of distribution
- The October earnings event marked a significant turning point, with a sharp rejection candle signalling that sellers had arrived in size at the highs
- From November onward, price deteriorated steadily through December before the catastrophic January 2026 collapse
- The January crash — likely triggered by an adverse clinical or regulatory event — saw CORT plunge from the mid-$70s to lows near $32–$33 in a matter of days
- Volume during the crash was extraordinary, dwarfing every other session in the visible chart history and confirming forced institutional Liquidation
- RSI collapsed to near-20 levels — the most extreme oversold reading in the entire chart period — reflecting the severity of the Capitulation
The violence and speed of the decline suggested a fundamental catalyst rather than purely technical deterioration, making the subsequent recovery all the more remarkable.
Phase 3 — Base Formation, Recovery & Explosive Breakout (Feb – May 2026)
From the January 2026 crash lows, CORT has executed one of the most impressive recovery sequences in recent biotech history:
- Price initially stabilised in the $32–$38 range through January and early February as panic selling exhausted itself
- A significant February volume spike marked the moment institutional buyers began aggressively accumulating at distressed prices
- From March onward, price began a steady and accelerating recovery — advancing from $38 toward $50, then $55, then $60, and now $66.71
- EMA-21 crossed decisively above EMA-50 in April, confirming the golden cross and restoration of full bullish moving-average alignment
- RSI has climbed from near-20 crash lows all the way to 82 today — one of the most powerful momentum recoveries visible on this chart
- Today's +10.52% session, closing at the absolute daily high, represents a decisive reclaim of the pre-crash price territory around $65–$68
The stock has now completed a full round-trip recovery from the January collapse, positioning bulls for a potential challenge of the pre-crash highs near $80+.
Moving Averages: Golden Cross Confirmed as Bullish Alignment Strengthens
EMA-21 ($55.25)
- Price trades $11.46 above this level — a wide and expanding separation that confirms exceptional short-term momentum
- The EMA-21 has been rising steeply since late March, reflecting the accelerating pace of the recovery
- Each pullback toward the EMA-21 zone throughout the recovery phase has been brief and immediately met with renewed buying interest
- Current positioning well above the EMA-21 keeps near-term bulls firmly and completely in control of the daily trend
EMA-50 ($49.83)
- The EMA-50 has turned sharply higher after bottoming out following the crash — a critical structural development confirming medium-term trend recovery
- Price trades $16.88 above this level, reflecting the full restoration of healthy bullish trend separation
- The EMA-21 trading above the EMA-50 in a confirmed golden cross configuration provides the strongest possible medium-term technical endorsement
- A sustained hold above the EMA-50 at $49.83 preserves the complete bullish recovery thesis across all timeframes
The current golden cross configuration, combined with dramatically rising moving averages and a wide bullish price separation, represents the clearest possible technical signal that the January crash has been structurally overcome and that a new bullish phase is firmly underway.
Momentum Analysis: RSI Above 80 Signals Genuine Institutional Re-Rating
RSI-14 at 82.01 with the signal line at 73.16 places CORT in deep overbought territory — but the context of this reading is critical to interpret correctly.
Current RSI behaviour indicates:
- An RSI above 80 following a complete recovery from crash lows is distinctly different from an RSI above 80 at an all-time high — it reflects catch-up buying rather than exhausted speculation
- The RSI signal line at 73.16 sits well below the current reading, confirming that momentum is freshly accelerating on today's breakout session rather than rolling over
- The RSI journey from near-20 crash lows to 82 today is one of the most complete momentum reversals observable in the visible chart history — spanning virtually the entire indicator range
- Prior RSI peaks in the pre-crash uptrend resolved through healthy consolidation before resuming higher, suggesting the same pattern could repeat in the current recovery
- At current levels, near-term consolidation is statistically likely, but the broader momentum structure remains decisively bullish
A daily RSI at 82 backed by a +10.52% close-at-high session signals that this is not retail momentum chasing — this is institutional Capital re-establishing positions at a stock that has fundamentally recovered its Investment thesis.
Volume Analysis: Institutional Accumulation Pattern Clearly Visible
The volume profile across the full chart period tells a compelling story of crash, capitulation, and institutional re-accumulation:
- The January 2026 crash generated the single largest volume event in the entire chart history — a classic panic capitulation that marks the final exhaustion of sellers
- The subsequent February volume spike on a constructive price day confirmed that institutional buyers were stepping in aggressively at the lows
- Throughout the March–May recovery, volume has been consistently supportive without showing signs of distribution into the rally
- Today's 1.57M session on a +10.52% close-at-high day represents a high-conviction accumulation event — likely another earnings catalyst driving fresh institutional positioning
- The absence of high-volume distribution days during the recovery phase is a critical confirmation that sellers have been fully absorbed and buyers now control the order flow
Key Technical Levels
Resistance Levels
- $67–$68 — immediate resistance at current breakout highs
- $72–$75 — intermediate resistance from pre-crash consolidation zone
- $80–$85 — major resistance at the pre-crash all-time highs — the ultimate recovery target
Support Levels
- $55–$56 — EMA-21 and key short-term trend support
- $49–$50 — EMA-50 and primary medium-term structural support
- $42–$44 — prior recovery consolidation zone and deeper support
- $32–$34 — major structural support at the January 2026 crash lows
Scenario Analysis
- Bullish Continuation (Primary Case)
If CORT sustains above the EMA-21 near $55 following any near-term consolidation: → The path toward $72–$75 intermediate resistance becomes the primary technical target → A sustained hold above $68 would confirm the breakout and open the door toward a challenge of the pre-crash $80–$85 highs → Continued positive clinical or commercial developments could accelerate the fundamental re-rating already underway
- Sideways Consolidation (Constructive Outcome)
Following today's powerful +10.52% session, a period of consolidation near $63–$67 is entirely healthy: → RSI gradually retreats from extreme overbought levels while price holds the breakout zone → EMA-21 continues rising beneath price, compressing the gap and strengthening the support base → A tight consolidation above $63 would set up an even more powerful continuation breakout toward $72+
- Bearish Breakdown (Risk Case)
A Reversal back below EMA-50 near $49.83 would raise serious concerns about the recovery thesis: → Downside risk could expand toward the $42–$44 prior consolidation zone → RSI would deteriorate sharply and likely break back below neutral — signalling momentum failure → However, given the extraordinary strength of today's session and the quality of the broader recovery structure, this remains the decisively lower-probability outcome
Conclusion: CORT Completes One of the Most Remarkable Recovery Sequences in Recent Biotech History
Corcept Therapeutics has delivered a technically and fundamentally extraordinary performance over the past five months — navigating a catastrophic January crash, building a disciplined recovery base, and today staging a decisive +10.52% breakout that reclaims the pre-crash price territory in full. The golden cross of EMA-21 above EMA-50, the RSI recovery from near-20 to 82, the clean close at the absolute daily high, and the supportive institutional volume profile all combine to paint one of the most compelling bullish technical pictures in the current biotech landscape.
The framework moving forward remains clear:
- Above EMA-21 at $55.25 → bullish momentum remains fully intact and continuation toward $72–$75 is the primary scenario
- Above $68 → breakout confirmation strengthens and a challenge of the pre-crash $80–$85 highs becomes increasingly viable
- Below EMA-50 at $49.83 → caution increases materially and the recovery thesis requires reassessment
For momentum-focused biotech investors, CORT represents a rare technical setup — a stock that has not only survived a devastating crash event but has emerged structurally stronger, with institutional buyers having used the collapse as a generational accumulation opportunity that is now being decisively validated by price action.


 Please wait processing your request...