
 CA
 NZ
 UK
 AU
 IND

 US

 Share
 X (Formerly Twitter)
 Whatsapp
 Facebook
 LinkedIn
 Telegram
 Email This Article
 Copy Link
 Summarize with AI
 Chat GPT
 Perplexity

Why is JFrog (NASDAQ: FROG) pushing toward its August high, and can it clear $105?
Sector: Information Technology (Infrastructure Software)
JFrog Ltd. (NASDAQ: FROG) is trading near the top of its 2026 range. As of this chart snapshot (about 1 hour 45 minutes before the close), shares are at $102.17, up $3.15 (+3.18%). The stock opened at $98.46, slightly below Monday’s close near $99.02, then reversed to an intraday high of $103.39. The low of $98.00 held above the 21-day EMA, and price sits close to the late-August peak near $105. I could not confirm a company-specific catalyst, so the case rests on the chart. 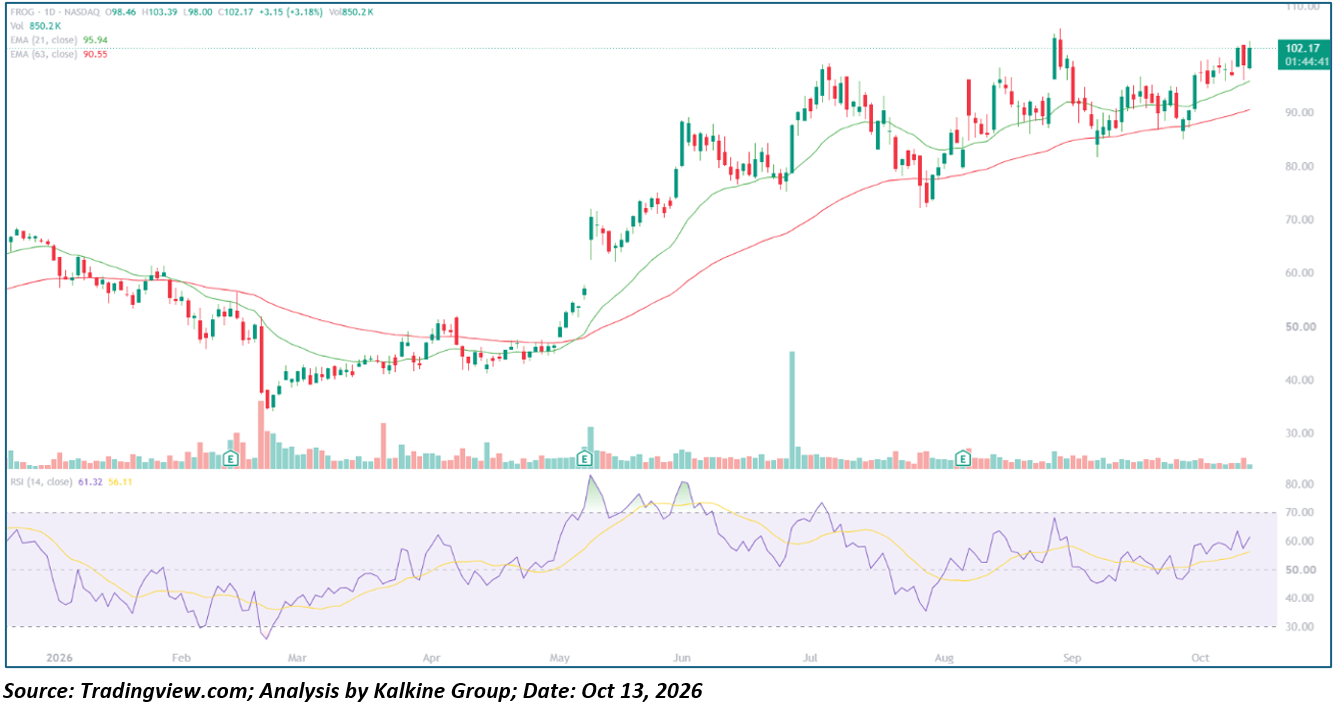
Key Highlights
- Trading at $102.17, up $3.15 (+3.18%), on partial-session Volume of 850.2K shares
- Opened at $98.46, low of $98.00, high of $103.39
- 21-day EMA at $95.94 and 63-day EMA at $90.55, both below price
- 14-day RSI at 61.32, above its 56.11 signal line
- Resistance at $103.39, about $105 and about $110; support at $98 to $99 and $95.94
Trend Structure: Three-Act Pattern
- Breakdown (January – February 2026): The stock slid from the high $60s to a low near $34 in late February. The drop came with a heavy-volume gap down around an Earnings date.
- Rebuild and Breakout (March – July 2026): FROG based in the $40s through April. It gapped up around the May earnings report and ran past $88 in June. A heavy-volume spike in late June (cause unconfirmed) came just before a test of $100 in early July.
- Higher Range (July – October 2026): After a pullback to about $72 in late July, the stock spiked to about $105 in late August. It then consolidated between roughly $82 and $97 in September, with dips testing the 63-day EMA in early September and again around October 1. Today’s move takes price back to the top of that range.
Backdrop
The chart marks earnings in February, May and August, and each report was followed by a large move. The next report is typically due in early November, so confirm the date. It is likely the next major catalyst.
Moving Averages and Momentum Profile
- Moving Average Stack: The 21-day EMA ($95.94) is above the 63-day EMA ($90.55), and both slope upward. Price is about 6.5% above the 21-day and about 13% above the 63-day, which is a clear uptrend structure.
- Higher Lows: The 63-day EMA has held every pullback since July, and each dip has made a higher low.
- Oscillator Behavior: RSI at 61.32 is above its signal line and well below the 70 overbought line, which leaves room to run.
- Volume Behavior: Volume of 850.2K is partial and light compared with the earnings and late-June spikes. A breakout above $105 would carry more weight on above-average volume.
Key Technical Levels
|
Level |
Type |
Note |
|
$110 |
Resistance |
Round-number and chart ceiling |
|
~$105 |
Resistance |
Late-August swing high |
|
$103.39 |
Resistance |
Today’s intraday high |
|
$102.17 |
Reference |
Current price |
|
~$99.02 |
Support |
Monday’s close |
|
$98.00 |
Support |
Today’s low |
|
$95.94 |
Support |
21-day EMA |
|
$90.55 |
Support |
63-day EMA |
|
~$85 |
Support |
Late-September swing low |
Actionable Technical Outlook
- A close above about $105 would be a new 2026 high and put $110 in play.
- The structure stays constructive while price holds above $98 to $99. A close below the 21-day EMA ($95.94) would signal fading momentum, with $90.55 as the next reference.
- This is the second approach to the same $105 area, so a stall and retest of $98 to $100 is possible before any breakout. This is a technical read, not Investment advice.
Metadata
|
Field |
Value |
|
Headline |
Why is JFrog (NASDAQ: FROG) pushing toward its August high, and can it clear $105? |
|
SEO title |
JFrog (FROG) Near 52-Week High: EMA Support and $105 Levels |
|
Meta description |
JFrog (NASDAQ: FROG) rises 3.2% to $102.17 near its 52-week high. RSI 61, EMA support and key resistance levels for traders. |
|
Slug |
why-jfrog-frog-nasdaq-stock-near-52-week-high-105-levels |
|
Tags |
JFrog, FROG, NASDAQ, infrastructure software, technical analysis, moving averages, 52-week high |
|
Ticker / Sector |
FROG / Information Technology |
|
Verification status |
PARTIAL (levels read from the chart; 52-week high and catalyst not confirmed) |
|
Data as-of date |
October 13, 2026 (intraday) |
ARTICLE 2: Nutanix (NTNX)
Why is Nutanix (NASDAQ: NTNX) stalling near $75, and can it hold above its 21-day EMA?
Sector: Information Technology (Infrastructure Software)
Nutanix, Inc. (NASDAQ: NTNX) is pulling back slightly after setting a new 2026 high. As of this chart snapshot (about 1 hour 45 minutes before the close), shares are at $73.41, down $0.73 (-0.98%). The stock opened at $73.37 and ranged from $72.81 to $75.28. The prior session reached about $76 before closing lower, so the upper-wick rejection near the high is the key feature. The trend remains intact, with price above both EMAs. I could not confirm a company-specific catalyst, so the case rests on the chart. 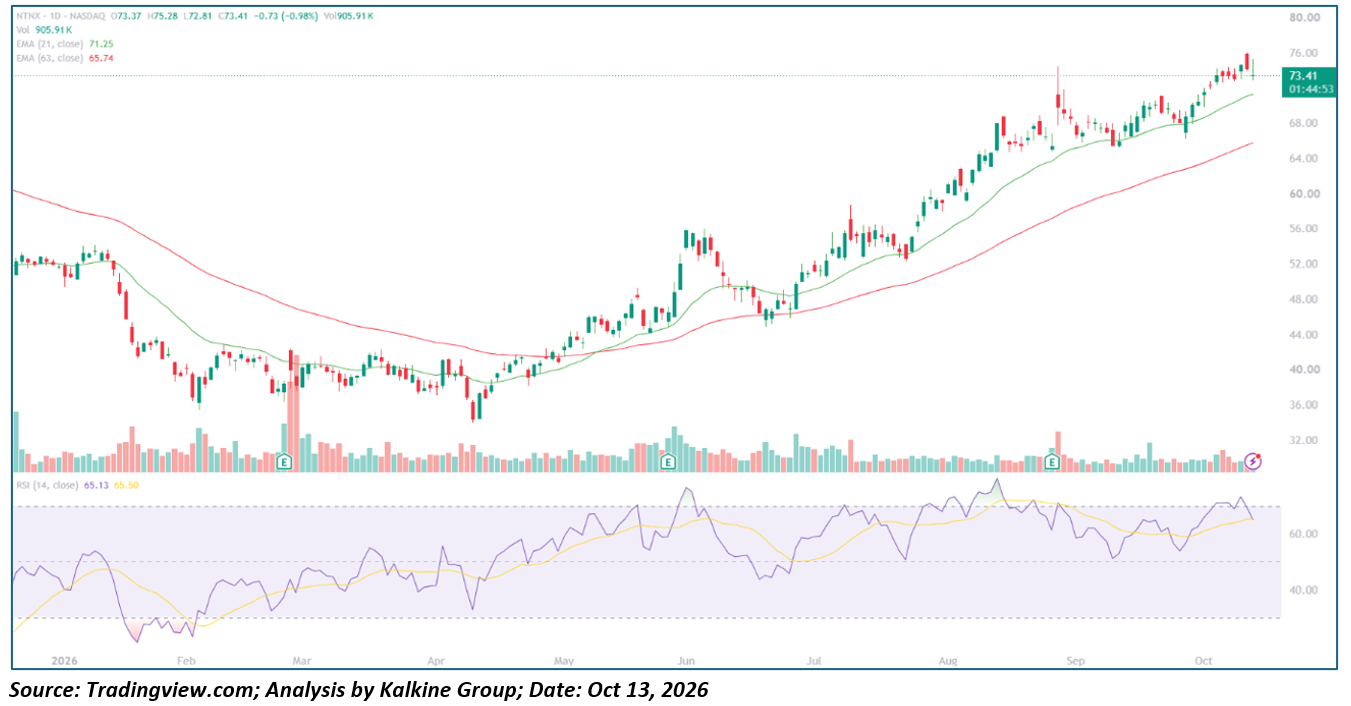
Key Highlights
- Trading at $73.41, down $0.73 (-0.98%), on partial-session volume of 905.91K shares
- Opened at $73.37, low of $72.81, high of $75.28
- 21-day EMA at $71.25 and 63-day EMA at $65.74, both below price
- 14-day RSI at 65.13, just below its 65.50 signal line
- Resistance at about $76 and $75.28; support at $72.81, $71.25 and $65.74
Trend Structure: Three-Act Pattern
- Decline (January – April 2026): The stock fell from about $53 to the mid-$30s in January and February. After a bounce to about $42 in March, it made a final low near $34 in early April.
- Recovery (April – July 2026): NTNX turned up from the April low and climbed through the 63-day EMA. It reached about $56 in early June, pulled back to the mid-$40s, and then began a steady climb.
- Trending Advance (July – October 2026): Price climbed in an orderly channel above the 21-day EMA, reaching about $69 in August and a spike to about $74.5 around the late-August earnings date. September consolidated between roughly $65 and $71, with a dip to about $66 near October 1. The stock has since broken to new highs near $76. That is roughly double the April low.
Backdrop
The chart marks earnings in late February, late May and late August, with the biggest volume at the late-August report. The next report is typically due in late November, so confirm the date. Until then, price and the moving averages drive the setup.
Moving Averages and Momentum Profile
- Moving Average Stack: The 21-day EMA ($71.25) is above the 63-day EMA ($65.74), and both slope upward. Price is about 3% above the 21-day and about 12% above the 63-day, so the 21-day is the nearest support.
- Candle Behavior: The prior session’s upper wick and today’s small pullback show sellers near $75 to $76. Price has not yet closed back near the 21-day EMA.
- Oscillator Behavior: RSI at 65.13 is curling down from the high 60s and sits just under its signal line. Price made a new high while RSI stayed below its August peak, a mild momentum divergence.
- Volume Behavior: Volume of 905.91K is partial and in line with recent sessions. There is no heavy distribution yet, but no surge on the breakout either.
Key Technical Levels
|
Level |
Type |
Note |
|
$80 |
Resistance |
Round-number chart ceiling |
|
~$76 |
Resistance |
Prior session’s high, new 2026 high |
|
$75.28 |
Resistance |
Today’s intraday high |
|
$73.41 |
Reference |
Current price |
|
$72.81 |
Support |
Today’s low |
|
$71.25 |
Support |
21-day EMA |
|
~$66 |
Support |
Early-October swing low |
|
$65.74 |
Support |
63-day EMA |
Actionable Technical Outlook
- A close above $76 would confirm the breakout and open the way toward $80.
- The trend stays constructive while price holds above the 21-day EMA ($71.25). A close below it would point to $66, where the early-October low and the 63-day EMA converge.
- The wick near $76, the RSI divergence and the lack of volume expansion suggest a pullback toward $71 to $72 is possible before any new high. This is a technical read, not investment advice.
Metadata
|
Field |
Value |
|
Headline |
Why is Nutanix (NASDAQ: NTNX) stalling near $75, and can it hold above its 21-day EMA? |
|
SEO title |
Nutanix (NTNX) Near 52-Week High: EMA Support and $76 Resistance |
|
Meta description |
Nutanix (NASDAQ: NTNX) trades at $73.41 near its 52-week high. RSI 65, 21-day EMA support and key levels for traders. |
|
Slug |
why-nutanix-ntnx-nasdaq-stock-near-52-week-high-ema-support-76-resistance |
|
Tags |
Nutanix, NTNX, NASDAQ, infrastructure software, technical analysis, moving averages, 52-week high |
|
Ticker / Sector |
NTNX / Information Technology |
|
Verification status |
PARTIAL (levels read from the chart; 52-week high and catalyst not confirmed) |
|
Data as-of date |
October 13, 2026 (intraday) |


 Nov 16, 2026





 Please wait processing your request...