
 CA
 NZ
 UK
 AU
 IND

 US

 Share
 X (Formerly Twitter)
 Whatsapp
 Facebook
 LinkedIn
 Telegram
 Email This Article
 Copy Link
 Summarize with AI
 Chat GPT
 Perplexity

Key Highlights
- Popular, Inc. (NASDAQ: BPOP) closed at $174.95, advancing to a fresh 52-week high while extending its bullish trend above both the 20-day EMA ($171.26) and 50-day EMA ($164.30), confirming sustained buying interest.
- The stock has staged an impressive recovery from its April lows, maintaining a consistent pattern of higher highs and higher lows, with rising moving averages reinforcing the strength of the prevailing uptrend.
- RSI-14 is hovering near 64, reflecting healthy bullish momentum without entering extreme overbought territory, suggesting the rally still has room to extend if buyers remain active.
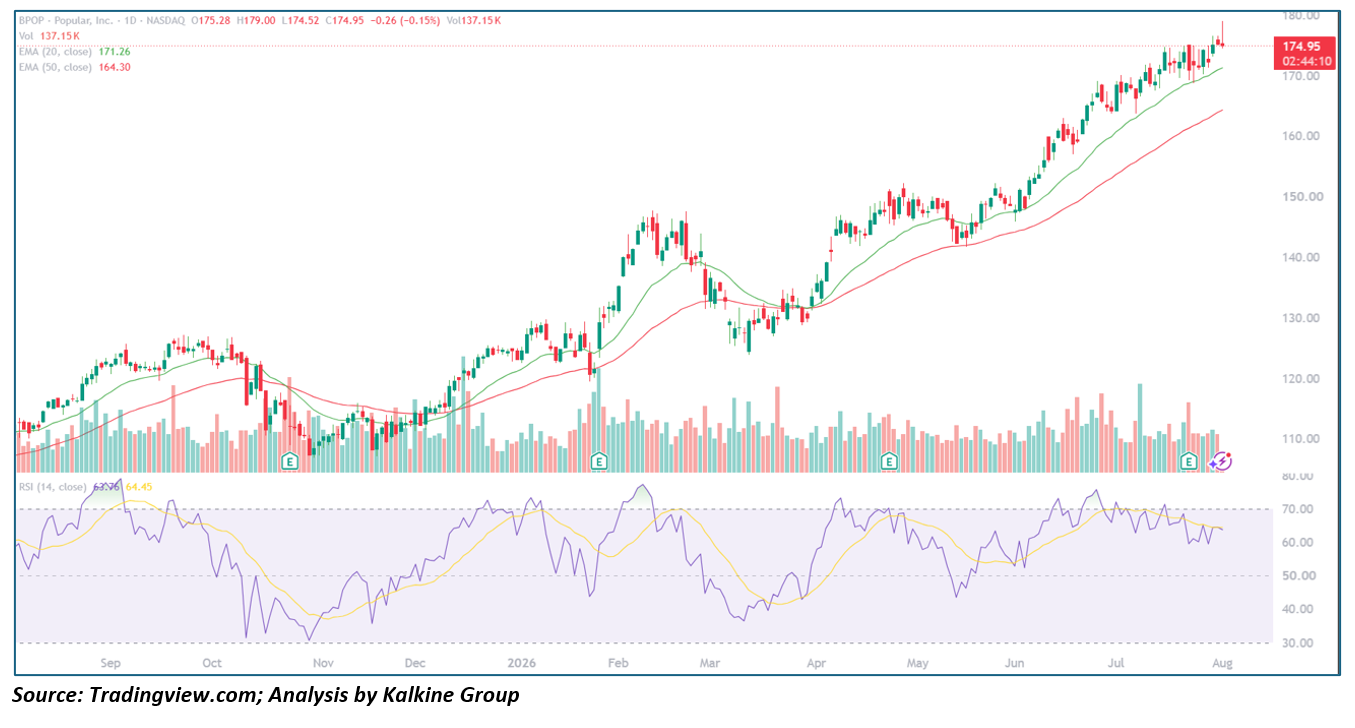
Trend Structure: Strong Recovery, Healthy Consolidation, and a Fresh Breakout
Phase 1 – Sharp Decline and Capitulation (February – April 2026)
BPOP began the period under pressure as broader weakness in financial stocks pushed the share price steadily lower. Selling accelerated into early April, driving the stock toward its yearly lows. During this phase, the 20-day EMA remained below the 50-day EMA, while momentum indicators reflected persistent bearish sentiment.
Phase 2 – Strong Recovery from April Lows (April – May 2026)
Following the April bottom, buyers returned aggressively, producing a sharp reversal that marked the beginning of a sustained recovery. The stock reclaimed both moving averages, and the 20-day EMA crossed above the 50-day EMA, generating a bullish technical crossover. Volume improved during the advance, confirming renewed institutional participation.
Phase 3 – Controlled Uptrend (May – July 2026)
Rather than advancing vertically, BPOP entered a disciplined uptrend characterized by higher highs and higher lows. Pullbacks remained shallow and repeatedly found support near the rising 20-day EMA, demonstrating that buyers continued accumulating shares on weakness. This constructive price action strengthened the overall trend while preventing excessive speculative conditions.
Phase 4 – Breakout to New 52-Week High (Late July – Early August 2026)
The latest rally has pushed Popular above its previous resistance zone, allowing the stock to register a fresh 52-week high. The breakout reflects growing bullish conviction as price continues trading comfortably above both key moving averages. Unlike many momentum-driven rallies, the breakout has occurred with orderly price action rather than excessive volatility, increasing the probability that the trend remains sustainable.
Moving Averages: Bullish Alignment Continues to Support the Trend
One of the strongest technical features of BPOP's chart is the alignment of its moving averages. The 20-day EMA continues to trade above the 50-day EMA, while both averages are rising steadily. This classic bullish configuration signals that short-term momentum remains stronger than the longer-term trend.
Price continues to hold well above both moving averages, indicating buyers remain firmly in control. Although the recent advance has slightly extended the distance between price and the 20-day EMA, the gap is not yet excessive compared with previous rallies, suggesting any short-term pullback could simply represent a healthy consolidation within the broader uptrend.
Momentum Analysis: RSI Signals Healthy Buying Pressure
The 14-day Relative Strength Index has climbed to approximately 64, placing momentum comfortably above the neutral 50 level while remaining below the traditional overbought threshold of 70.
This reading reflects strong bullish participation without suggesting excessive optimism. Earlier rallies on the chart have demonstrated that BPOP can sustain elevated RSI readings for extended periods before meaningful corrections develop. As long as RSI remains above the 55–60 region, momentum is likely to continue favoring buyers.
Investors should nevertheless monitor for bearish divergence or weakening momentum if RSI begins rolling over while price continues making new highs.
Key Technical Levels
Resistance
- $175.50–$176.00 – Immediate breakout resistance near the recent high.
- $180.00 – Psychological resistance and the next major upside objective.
- $185.00 – Extended bullish target if momentum accelerates.
Support
- $171.25 – 20-day EMA and first dynamic support.
- $168.00–$169.00 – Previous breakout zone.
- $164.30 – 50-day EMA and major trend support.
- $160.00 – Stronger structural support if a deeper correction develops.
Scenario Analysis
Bullish Scenario
If BPOP continues holding above the breakout level around $171–$172, buyers could drive the stock toward the psychological $180 level, with further upside extending toward $185 if momentum strengthens. Rising moving averages and healthy RSI readings continue to support this constructive outlook.
Base Case
The most likely outcome is a period of sideways consolidation between $171 and $176, allowing the moving averages to catch up while momentum resets. Such price action would strengthen the longer-term trend by creating a new support base before another advance.
Bearish Scenario
A decisive break below the 20-day EMA followed by weakness beneath the 50-day EMA would indicate that bullish momentum is fading. In that case, BPOP could revisit the $160–$164 support region before attracting fresh buying interest.
Conclusion
Popular, Inc. has delivered one of the strongest technical setups among regional banking stocks, breaking to a fresh 52-week high while maintaining a well-defined bullish trend. The combination of rising moving averages, improving momentum, and a consistent pattern of higher highs and higher lows suggests institutional buyers remain actively supporting the stock.
Although the recent rally leaves room for a brief consolidation after reaching new highs, the overall technical structure remains firmly constructive. As long as BPOP holds above its key moving averages and the recent breakout zone, the primary trend continues to favor further upside, with the $180–$185 range emerging as the next area of interest for bullish traders.
This technical analysis is based solely on the price chart provided and is intended for educational and informational purposes only. It should not be considered investment advice. Technical patterns can fail, and investment decisions should incorporate fundamental analysis, individual risk tolerance, and consultation with a qualified financial advisor where appropriate.


 Nov 17, 2026





 Please wait processing your request...