
 CA
 NZ
 UK
 AU
 IND

 US

 Share
 X (Formerly Twitter)
 Whatsapp
 Facebook
 LinkedIn
 Telegram
 Email This Article
 Copy Link
 Summarize with AI
 Chat GPT
 Perplexity

Petróleo Brasileiro S.A. (NYSE: PBR), the US-listed ADR of Brazil’s state-controlled oil company, is in a vertical advance. The stock has risen to $25.88 on the latest daily chart, up $0.38 (+1.47%) on the current candle. It opened at $25.64, reached a high of $25.96 and a low of $25.55. Price is well above its 21-day EMA at $22.95 and its 63-day EMA at $20.66, and it is at the highest level on the chart. However, the 14-day RSI has risen to 81.50, far above its signal line at 69.38. The trend is strong, but the stretch from its averages raises the chance of a pullback before any next leg higher. 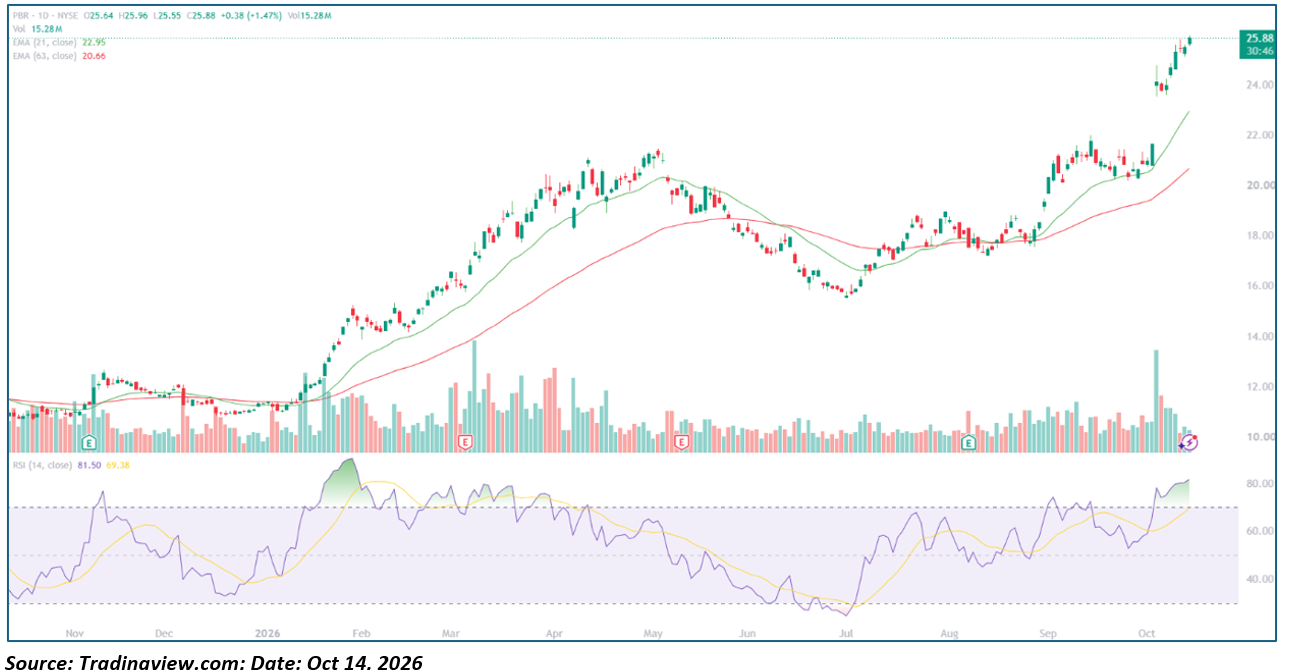
Key Highlights
- Trading at $25.88, up $0.38 (+1.47%) on the latest daily candle.
- Opened at $25.64, reached an intraday high of $25.96 and a low of $25.55.
- The 21-day EMA is $22.95, while the 63-day EMA is $20.66; price is above both averages.
- The 14-day RSI is 81.50, compared with its signal line at 69.38, indicating strong but clearly overbought momentum.
- There is no chart resistance above price. The nearest reference points are the $26.00 round number and the latest high of $25.96.
- Initial support lies near $23.50 (the early-October gap low), followed by the 21-day EMA at $22.95 and the 63-day EMA at $20.66.
Trend Structure: Four-Act Pattern
- Base (November 2025–January 2026): PBR traded in a tight range of roughly $11 to $12.50 as the two EMAs converged near $11.50. RSI dipped to the low 30s in December. The tight range set up the next advance.
- Rally and Peak (late January–early May 2026): The stock broke out in late January with RSI near 90, and it climbed through $14.50 in February and past $20 in April. It peaked near $21.40 in early May. This advance came with several large Volume spikes.
- Correction (May–early July 2026): PBR fell from about $21.40 to a low near $15.50 at the start of July. RSI dropped to about 25, and price lost both EMAs.
- Recovery and Breakout (July–October 2026): The stock recovered to the $17–$19 range in July and August, then broke higher in September to a swing high near $22. It consolidated between about $20 and $21.50 into late September. In early October, PBR gapped up from near $22 to about $23.50–$24.80 on the heaviest volume on the chart, and it has climbed in a nearly unbroken run since.
Backdrop
The chart shows its heaviest volume at the early-October gap, with earlier spikes during the February–April rally. The gap-up followed a period of tight consolidation just below $22, which suggests buyers took control at the breakout.
However, the chart alone does not establish whether a company-specific catalyst is driving the latest move. Oil prices, Brazilian currency moves, Dividend expectations, government policy and Earnings should be checked separately before attributing the rally to any one event.
Moving Averages and Momentum Profile
- Breakout Dynamics: PBR has cleared its September high near $22 and its May high near $21.40, so there is no prior swing high to act as overhead resistance. Holding above the gap zone would keep the structure intact, while a close back inside it would weaken it.
- Moving Average Structure: The 21-day EMA at $22.95 is above the 63-day EMA at $20.66, and both slope up, a constructive alignment. The gap between the two is wide, reflecting a fast move. Price is approximately 12.8% above the 21-day EMA and 25.3% above the 63-day EMA, which is a significant extension.
- Oscillator Behaviour: RSI stands at 81.50, above its signal line at 69.38 and well past the 70 overbought threshold. The chart shows RSI near 90 in January, and price still kept rising for roughly three more months. Overbought readings do not automatically signal a reversal, but they leave little cushion for disappointment.
- Volume Behaviour: The latest readout is 15.28M shares, with the session still in progress. Volume has been highest at the early-October gap and has faded since, even as price kept rising. Rising price on lower volume is a mild caution flag, and renewed volume expansion would give stronger confirmation.
Key Technical Levels
|
Level |
Type |
Note |
|
$26.00 |
Resistance |
Psychological round-number level |
|
$25.96 |
Resistance |
Latest candle’s high |
|
$25.88 |
Reference |
Latest chart price |
|
~$24.80 |
Resistance/Support |
Approximate early-October spike high |
|
$23.50 |
Support |
Early-October gap low |
|
$22.95 |
Support |
21-day EMA, inside the gap zone |
|
$22.00 |
Support |
September swing high, top of the gap zone |
|
$21.40 |
Support |
May swing high |
|
$20.66 |
Support |
63-day EMA |
|
$20.00 |
Support |
Late-September consolidation floor |
|
$15.50 |
Major support |
Late June/early July swing low |
Historical levels are approximate readings from the supplied daily chart. The chart does not provide exact closing prices for earlier swing points. Because the latest candle was still forming, today’s high, low and close can change.
Actionable Technical Outlook
- Bullish Scenario: A close above $26.00 would extend the breakout into price territory with no chart resistance. With nothing overhead, the next reference points are round numbers rather than prior highs.
- Pullback Scenario: Given the RSI reading of 81.50, PBR could consolidate or retreat toward the $23.50 gap low or the 21-day EMA near $22.95 before attempting another advance. A pullback to that area that holds would be a healthy digestion of the move.
- Bearish Scenario: A close inside the gap below $23.50 would weaken the immediate bullish structure. A move back under $22.00, the September high, would suggest the October surge is turning into a failed breakout, with the 63-day EMA near $20.66 as the next reference.
- Momentum Confirmation: The bullish outlook would improve if RSI cools without falling below 60, price holds above the 21-day EMA, and volume rises on subsequent advances. A sharp RSI drop alongside a close below the gap would warn of fading momentum.
The immediate technical question is whether PBR can keep pushing above $26.00 or must first consolidate toward the gap. Strong momentum favours the bulls, but the stretch above both EMAs makes chasing the move riskier than waiting for a controlled pullback.
Metadata
|
Field |
Value |
|
Headline |
Why Is Petrobras (NYSE: PBR) Surging Past $25, and Can the Rally Hold With RSI Above 80? |
|
SEO Title |
Petrobras (PBR) Stock Breakout: RSI Above 80, Moving Averages and $26 Level |
|
Meta Description |
Petrobras (NYSE: PBR) trades at $25.88, well above its 21-day and 63-day EMAs, as RSI reaches 81.50. Explore key support levels and the technical outlook. |
|
Slug |
petrobras-pbr-stock-technical-analysis-breakout-rsi-26-level |
|
Tags |
Petrobras, PBR, NYSE, technical analysis, RSI, moving averages, breakout stocks, energy stocks |
|
Ticker / Sector |
PBR / Energy |
|
Verification Status |
Chart-based analysis; company-specific catalyst, 52-week range and fundamentals not independently verified |
|
Data As Of |
October 15, 2026, approximately 00:59 IST, based on the supplied TradingView chart; the latest daily candle was still in progress |


 Nov 20, 2026





 Please wait processing your request...