 CA
 NZ
 UK
 AU
 IND

 US


…
Rexel S.A., together with its subsidiaries, engages in distribution of low and ultra-low voltage electrical products and services for the residential, commercial, and industrial energy markets in France, Europe, North America, and Asia-Pacific. The company offers smart cameras, sensors, controllers, and monitoring software; light sources, lights, and control switches; climate control products, including heat pumps, air conditioning, and water heaters; fire alarms, surveillance equipment, access controls devices, and emergency lightings; and connection cables, and switches and routers, as well as enclosures, mounts, and racks. It also provides solar modules and inverters; connected lighting, intelligent home system, home control touch screen, and smart thermostat products; residential chargers, commercial stations, and charging cables for electric vehicles; electric motors, variable speed drives, programmable logic controllers, and computers and operator interface; and fastening systems, electrical power and control, and valves and instrumentation products. The company offers products, services, and solutions in the fields of technical supply, automation, and energy management related to the construction, renovation, maintenance, and production. It operates a network of approximately 1,900 branches in 21 countries. The company was founded in 1967 and is headquartered in Paris, France.
Source: TradingView
The charts and visual representations are sourced from TradingView through embedded widgets. For any issues with chart display, please visit the TradingView website
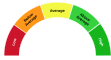
A unique technical analysis driven score developed by Kalkine showing momentum in stock prices based on select technical indicators identified.
Rexel SA is a global distributor of electrical products and services to professional customers in construction, industry and utilities. Long-term growth may be supported by electrification, energy-efficiency and renewables, digitalization of supply chains and expansion of services including e-mobility. Its scale and geographic reach appears positioned to deliver recurring revenues and operational leverage.
Principal risks include sensitivity to construction and industrial cycles, competitive and margin pressure in distribution, execution risk from digital transformation and acquisitions, and exposure to supply-chain, commodity and foreign-exchange volatility that investors should monitor.

Note: The summary and risk score provided above is created by AI and should not be construed as a recommendation of Kalkine.


| Breakdown | 2022-12-31 | 2021-12-31 | 2020-12-31 | 2019-12-31 | 2018-12-31 |
|---|---|---|---|---|---|
| Type | yearly | yearly | yearly | yearly | yearly |
| Date | 2022-12-31 | 2021-12-31 | 2020-12-31 | 2019-12-31 | 2018-12-31 |
| Income before tax | 1223.50M | 778.40M | -120.60M | 321.10M | 309.20M |
| Minority interest | 0.00M | -0.50M | -0.40M | 5.20M | 3.90M |
| Net income | 922.30M | 597.20M | -261.30M | 204.40M | 150.70M |
| Selling general administrative | 559.90M | 413.50M | 600.40M | 650.00M | 659.70M |
| Selling and marketing expenses | 313.70M | 269.30M | 241.30M | 247.80M | - |
| Gross profit | 4868.60M | 3871.60M | 3103.40M | 3432.00M | 3287.10M |
| Reconciled depreciation | 353.40M | 315.60M | 812.80M | 433.10M | 203.50M |
| Ebit | 1343.00M | 911.80M | 68.80M | 486.40M | 523.80M |
| Ebitda | 1724.80M | 1293.10M | 881.60M | 930.80M | 727.30M |
| Depreciation and amortization | 381.80M | 381.30M | 812.80M | 444.40M | 203.50M |
| Non operating income net other | - | - | - | - | 0.00M |
| Operating income | 1343.00M | 911.80M | 68.80M | 486.40M | 409.80M |
| Other operating expenses | 17318.80M | 13695.70M | 12024.00M | 13079.50M | 12757.20M |
| Interest expense | 104.30M | 93.60M | 104.50M | 115.30M | 73.60M |
| Tax provision | 301.20M | 180.80M | 140.70M | 117.30M | 157.00M |
| Interest income | 11.90M | 3.20M | 3.80M | 3.00M | 3.30M |
| Net interest income | -116.10M | -111.30M | -120.30M | -170.40M | -106.20M |
| Extraordinary items | - | - | - | - | 0.00M |
| Non recurring | - | - | - | - | 0.00M |
| Other items | - | - | - | - | 0.00M |
| Income tax expense | 301.20M | 180.80M | 140.70M | 117.30M | 157.00M |
| Total revenue | 18701.60M | 14690.20M | 12592.40M | 13742.30M | 13365.80M |
| Total operating expenses | 3485.80M | 2877.10M | 2535.00M | 2769.20M | 2678.50M |
| Cost of revenue | 13833.00M | 10818.60M | 9489.00M | 10310.30M | 10078.70M |
| Total other income expense net | -119.50M | -133.40M | -189.40M | -165.30M | -100.60M |
| Discontinued operations | - | - | - | - | 0.00M |
| Net income from continuing ops | 922.30M | 597.60M | -261.30M | 203.80M | 152.30M |
| Net income applicable to common shares | 922.30M | 597.20M | -261.20M | 204.40M | 134.00M |
| Preferred stock and other adjustments | - | - | - | - | 0.00M |
| Breakdown | 2022-12-31 | 2021-12-31 | 2020-12-31 | 2019-12-31 | 2018-12-31 |
|---|---|---|---|---|---|
| Type | yearly | yearly | yearly | yearly | yearly |
| Date | 2022-12-31 | 2021-12-31 | 2020-12-31 | 2019-12-31 | 2018-12-31 |
| Total assets | 12909.70M | 11553.70M | 9963.20M | 11074.80M | 10205.30M |
| Intangible assets | 1167.50M | 1159.00M | 997.50M | 1027.50M | 1038.80M |
| Other current assets | 0.10M | -0.10M | 0.20M | -0.10M | 2666.80M |
| Total liab | 7627.90M | 6992.90M | 6168.40M | 6839.50M | 5973.10M |
| Total stockholder equity | 5281.80M | 4560.40M | 3795.10M | 4230.10M | 4228.40M |
| Deferred long term liab | - | - | - | - | 0.00M |
| Other current liab | 1226.00M | 338.90M | 263.40M | 248.50M | 715.30M |
| Common stock | 1517.10M | 1528.60M | 1522.10M | 1520.50M | 1519.90M |
| Capital stock | 1517.10M | 1528.60M | 1522.10M | 1520.50M | 1519.90M |
| Retained earnings | 2716.80M | 1783.20M | 1148.80M | 1404.40M | 1226.50M |
| Other liab | 475.80M | 473.80M | 551.80M | 537.50M | 529.20M |
| Good will | 3454.50M | 3401.70M | 3192.20M | 3785.50M | 3871.00M |
| Other assets | 130.00M | 65.60M | 38.80M | 0.10M | 105.70M |
| Cash | 895.40M | 573.50M | 685.40M | 514.30M | 544.90M |
| Total current liabilities | 4343.90M | 4253.40M | 2864.50M | 3722.40M | 3482.40M |
| Current deferred revenue | - | 713.40M | 508.10M | 539.80M | 88.60M |
| Net debt | 2658.70M | 2723.30M | 2352.50M | 2977.70M | 2045.20M |
| Short term debt | 746.10M | 1031.10M | 285.70M | 912.40M | 653.90M |
| Short long term debt | 542.50M | 832.30M | 113.40M | 912.40M | 649.40M |
| Short long term debt total | 3554.10M | 3296.80M | 3037.90M | 3492.00M | 2590.10M |
| Other stockholder equity | 1047.90M | 3031.80M | 2273.00M | 1305.20M | 2708.50M |
| Property plant equipment | 1429.90M | 1319.00M | 1148.80M | 1171.50M | 1100.00M |
| Total current assets | 6727.90M | 5553.50M | 4553.70M | 4980.90M | 4885.90M |
| Long term investments | - | - | - | 29.30M | 24.90M |
| Net tangible assets | 659.90M | -0.30M | -394.60M | -582.90M | -766.50M |
| Short term investments | - | - | -41.00M | -49.00M | 0.00M |
| Net receivables | 3557.00M | 2922.90M | 2357.00M | 2769.80M | 2583.80M |
| Long term debt | 1768.50M | 1290.60M | 1915.20M | 2579.60M | 1925.00M |
| Inventory | 2275.40M | 2057.20M | 1511.10M | 1696.90M | 1674.20M |
| Accounts payable | 2371.80M | 2170.00M | 1807.30M | 2021.70M | 2024.60M |
| Total permanent equity | - | - | - | - | 0.00M |
| Noncontrolling interest in consolidated entity | - | - | - | - | 0.00M |
| Temporary equity redeemable noncontrolling interests | - | - | - | - | 0.00M |
| Accumulated other comprehensive income | - | - | - | - | 0.00M |
| Additional paid in capital | - | - | - | - | 0.00M |
| Common stock total equity | - | - | - | - | 0.00M |
| Preferred stock total equity | - | - | - | - | 0.00M |
| Retained earnings total equity | - | - | - | - | 0.00M |
| Treasury stock | - | - | - | - | 0.00M |
| Accumulated amortization | - | - | - | - | 0.00M |
| Non currrent assets other | 66.40M | 56.60M | 0.10M | -0.10M | 42.70M |
| Deferred long term asset charges | - | - | - | - | 0.00M |
| Non current assets total | 6181.80M | 6000.20M | 5409.50M | 6093.80M | 5319.40M |
| Capital lease obligations | 1243.10M | 1168.80M | 1005.70M | 1010.00M | 15.70M |
| Long term debt total | - | - | - | - | 0.00M |
| Breakdown | 2022-12-31 | 2021-12-31 | 2020-12-31 | 2019-12-31 | 2018-12-31 |
|---|---|---|---|---|---|
| Type | yearly | yearly | yearly | yearly | yearly |
| Date | 2022-12-31 | 2021-12-31 | 2020-12-31 | 2019-12-31 | 2018-12-31 |
| Investments | -182.10M | -3.10M | -4.30M | -4.00M | 1.00M |
| Change to liabilities | 214.10M | 183.90M | -150.10M | -3.80M | 14.20M |
| Total cashflows from investing activities | -182.10M | -542.30M | 67.60M | -118.20M | -92.30M |
| Net borrowings | 9.70M | -163.90M | -569.40M | -325.70M | -183.00M |
| Total cash from financing activities | -286.60M | -299.70M | -580.20M | -456.30M | -158.20M |
| Change to operating activities | -45.20M | 115.10M | 71.60M | -22.30M | -15.10M |
| Net income | 1343.00M | 911.80M | -3.40M | 486.30M | 409.80M |
| Change in cash | 321.90M | -111.90M | 171.10M | -30.60M | -18.70M |
| Begin period cash flow | 573.50M | 685.40M | 514.30M | 544.90M | 563.60M |
| End period cash flow | 895.40M | 573.50M | 685.40M | 514.30M | 544.90M |
| Total cash from operating activities | 840.10M | 717.60M | 706.90M | 552.80M | 284.70M |
| Issuance of capital stock | - | - | - | - | 0.00M |
| Depreciation | 353.40M | 315.60M | 812.80M | 433.10M | 203.50M |
| Other cashflows from investing activities | - | -0.10M | -0.10M | -0.10M | -0.10M |
| Dividends paid | -230.10M | -139.60M | 139.60M | -133.00M | 126.80M |
| Change to inventory | -228.40M | -349.30M | 113.60M | -62.70M | -130.30M |
| Change to account receivables | -332.40M | -158.70M | 87.40M | 18.70M | -28.70M |
| Sale purchase of stock | -66.30M | - | - | - | -10.20M |
| Other cashflows from financing activities | 63.90M | 959.50M | -183.30M | 421.60M | -4.70M |
| Change to netincome | -40.20M | 21.50M | 551.70M | 122.40M | 188.90M |
| Capital expenditures | 131.40M | 109.30M | 109.60M | 124.30M | 117.80M |
| Change receivables | - | - | - | - | 0.00M |
| Cash flows other operating | - | - | - | - | 0.00M |
| Exchange rate changes | - | - | - | - | 0.00M |
| Cash and cash equivalents changes | - | - | - | - | 0.00M |
| Change in working capital | -391.90M | -209.00M | 122.50M | -70.10M | -161.80M |
| Other non cash items | -464.40M | -300.80M | -225.00M | -296.50M | -166.80M |
| Free cash flow | 708.70M | 608.30M | 597.30M | 428.50M | 166.90M |
Sector: Technology Industry: Electronics & Computer Distribution
|
Stock Name
|
Change
(USD) |
Price
(USD) |
Trailing
PE (x) |
Forward
PE (x) |
Price Sales
TTM (x) |
Price to Book Value (x)
|
Enterprise Value
to Revenue (x) |
Enterprise Value
to EBITDA (x) |
|---|---|---|---|---|---|---|---|---|
| RXEEY Rexel SA ADR |
0.88 2.34% |
38.43 | 8.47 | 9.43 | 0.42 | 1.39 | 0.60 | 7.00 |
| SNX TD SYNNEX Corporation |
2.02 0.79% |
256.74 | 15.59 | 9.45 | 0.16 | 1.15 | 0.21 | 8.04 |
| ARW Arrow Electronics Inc |
3.29 1.50% |
222.95 | 16.28 | 5.03 | 0.29 | 1.38 | 0.39 | 11.09 |
| RXLSF Rexel S.A |
- -% |
38.29 | 7.10 | 7.96 | 0.42 | 1.17 | 0.60 | 7.00 |
| AVT Avnet Inc |
0.62 0.67% |
93.57 | 23.04 | 7.10 | 0.28 | 1.51 | 0.39 | 12.78 |
Rexel S.A., together with its subsidiaries, engages in distribution of low and ultra-low voltage electrical products and services for the residential, commercial, and industrial energy markets in France, Europe, North America, and Asia-Pacific. The company offers smart cameras, sensors, controllers, and monitoring software; light sources, lights, and control switches; climate control products, including heat pumps, air conditioning, and water heaters; fire alarms, surveillance equipment, access controls devices, and emergency lightings; and connection cables, and switches and routers, as well as enclosures, mounts, and racks. It also provides solar modules and inverters; connected lighting, intelligent home system, home control touch screen, and smart thermostat products; residential chargers, commercial stations, and charging cables for electric vehicles; electric motors, variable speed drives, programmable logic controllers, and computers and operator interface; and fastening systems, electrical power and control, and valves and instrumentation products. The company offers products, services, and solutions in the fields of technical supply, automation, and energy management related to the construction, renovation, maintenance, and production. It operates a network of approximately 1,900 branches in 21 countries. The company was founded in 1967 and is headquartered in Paris, France.
| Name | Title | Year Born |
|---|---|---|
| Mr. Guillaume Jean Philippe Texier | CEO & Director | 1974 |
| Mr. Laurent Delabarre | Group Chief Financial Officer | 1966 |
| Mr. Ludovic Debailleux | Investors Relations Director | NA |
| Ms. Sabine Haman | Group Chief HR & Communications Officer | 1968 |
| Mr. Grégoire Bertrand | Chief Financial Officer of Europe | NA |
| Mr. Roger Little | Chief Exec. Officer of Canada | NA |
| Ms. Nathalie Wright | Chief Digital, IT & Sustainability Officer | 1964 |
| Mr. Pierre Benoit | Chief Exec. Officer of United Kingdom & Ireland - Benelux | NA |
| Ms. Constance Grisoni | Chief Strategy Officer & Group Strategy Director | NA |
| Mr. Thomas Moreau | Chief Exec. Officer of France | 1978 |
Disclaimer - (*)This information, including any data, is sourced from Unicorn Data Services SAS, trading as EOD Historical Data (“EODHD”) on an ‘as is’ basis, using their API. We cannot guarantee the completeness or validity of the information and data provided on this page, as well as via the API. In some cases, the data may include analyst ratings or recommendations sourced through the EODHD API, which are intended solely for general information purposes.
This information does not consider your personal objectives, financial situation, or needs. Kalkine is not liable for any errors or omissions in the information provided or for any actions taken in reliance on it. You should seek advice from a financial adviser, stockbroker or other professional adviser (including taxation and legal advice) as necessary before acting on this information.

Download a free report with stock ideas and industry insights for general information.
Download Free Report Now →


Basic Materials
 +0.02%
Communication Services
 -0.63%

Consumer Cyclical
-0.11%

Consumer Defensive
-0.45%

Energy
+0.39%

Financial Services
-0.10%
Financials
-0.81%

Healthcare
+1.03%

Industrials
+0.32%

Real Estate
-0.31%

Technology
+0.59%

Utilities
-0.18%
Note: Daily price change (%) by sector excluding stocks with +/-90% daily price change. Companies above $500 million market capitalization are considered.
 Portfolio
 Watchlist


 Please wait processing your request...