 CA
 NZ
 UK
 AU
 IND

 US


…
Marks and Spencer Group plc operates various retail stores. It operates through Fashion, Home & Beauty; Food; International; and Ocado segments. The company offers womenswear, menswear, lingerie, kids wear, beauty, and home products through UK and ROI, retail stores, and online. It also provides meat, fish, protein deli and dairy; produce and floral; meals, frozen, and food on the move; core basket; beers, wines, and spirits; and impulse and events, and hospitality services. In addition, it operates international franchises; and provides banking services. The company also exports its products. The company was founded in 1884 and is based in London, the United Kingdom.
Source: TradingView
The charts and visual representations are sourced from TradingView through embedded widgets. For any issues with chart display, please visit the TradingView website
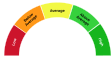
A unique technical analysis driven score developed by Kalkine showing momentum in stock prices based on select technical indicators identified.
Marks & Spencer Group Plc operates UK-focused retailing of clothing, home and food through stores and an omnichannel platform, with sizeable food halls and international franchising. Long-term growth drivers include higher-margin food and convenience formats, omnichannel expansion, estate rationalization and cost-savings that could support margin recovery, and international franchise growth may benefit revenue mix and resilience.
Material risks include intense competition across apparel and grocery, sensitivity to UK consumer spending and inflation, execution risk on the turnaround and restructuring program, legacy pension obligations and supply‑chain or currency pressures.

Note: The summary and risk score provided above is created by AI and should not be construed as a recommendation of Kalkine.


| Breakdown | 2026-03-31 | 2025-03-31 | 2024-03-31 | 2023-03-31 | 2022-03-31 |
|---|---|---|---|---|---|
| Type | yearly | yearly | yearly | yearly | yearly |
| Date | 2026-03-31 | 2025-03-31 | 2024-03-31 | 2023-03-31 | 2022-03-31 |
| Income before tax | 364.60M | 511.80M | 672.50M | 475.70M | 391.70M |
| Minority interest | 23.20M | 3.80M | 6.00M | 1.10M | -2.40M |
| Net income | 259.40M | 295.70M | 431.20M | 363.40M | 306.60M |
| Selling general administrative | 1047.60M | 780.80M | 852.00M | 912.90M | 770.60M |
| Gross profit | 5551.80M | 4738.10M | 4328.20M | 4144.60M | 3754.80M |
| Reconciled depreciation | 650.70M | 542.60M | 526.30M | 523.20M | 510.70M |
| Ebit | - | - | - | 672.40M | 773.10M |
| Ebitda | - | - | - | 1195.20M | 1191.70M |
| Operating income | 994.70M | 667.90M | 794.10M | 515.10M | 590.80M |
| Other operating expenses | - | - | - | 11283.30M | 114.70M |
| Interest expense | 194.50M | 165.00M | 173.90M | 196.30M | 213.60M |
| Tax provision | 128.40M | 219.90M | 247.30M | 111.20M | 82.70M |
| Interest income | 45.00M | 64.70M | 82.00M | 57.20M | 22.40M |
| Net interest income | -161.70M | -104.90M | -98.20M | -147.40M | -186.10M |
| Income tax expense | - | - | - | - | 82.70M |
| Total revenue | 17273.60M | 13816.80M | 13040.10M | 11931.30M | 10885.10M |
| Total operating expenses | 16278.90M | 13148.90M | 12246.00M | 11372.70M | 10294.30M |
| Cost of revenue | 11721.80M | 9078.70M | 8711.90M | 7786.70M | 7130.30M |
| Net income from continuing ops | 236.20M | 291.90M | 425.20M | 364.50M | 309.00M |
| Net income applicable to common shares | - | - | - | - | 306.60M |
| Breakdown | 2026-03-31 | 2025-03-31 | 2024-03-31 | 2023-03-31 | 2022-03-31 |
|---|---|---|---|---|---|
| Type | yearly | yearly | yearly | yearly | yearly |
| Date | 2026-03-31 | 2025-03-31 | 2024-03-31 | 2023-03-31 | 2022-03-31 |
| Total assets | 10114.80M | 8821.40M | 8682.20M | 9097.80M | 9443.40M |
| Intangible assets | 442.30M | 159.00M | 151.10M | 134.70M | 163.90M |
| Other current assets | - | 0.40M | - | 22.60M | 52.40M |
| Total liab | 6891.90M | 5989.50M | 5852.10M | 6282.90M | 6525.50M |
| Total stockholder equity | 3056.10M | 2820.60M | 2831.20M | 2810.50M | 2913.70M |
| Other current liab | - | - | - | - | 326.90M |
| Common stock | - | - | - | - | 19.70M |
| Capital stock | 20.70M | 20.60M | 20.50M | 19.80M | 19.70M |
| Retained earnings | 5982.80M | 5769.00M | 5789.60M | 5839.10M | 5897.90M |
| Other liab | - | - | - | - | 593.70M |
| Good will | 311.80M | 28.40M | 28.40M | 28.40M | 28.60M |
| Other assets | - | - | - | 800.20M | 1350.90M |
| Cash | 997.20M | 864.50M | 1022.40M | 1067.90M | 1197.90M |
| Total current liabilities | 2997.10M | 2777.50M | 2516.20M | 2706.40M | 2370.80M |
| Net debt | - | - | - | 278.50M | 331.60M |
| Short long term debt | 8.20M | 127.80M | 30.10M | 227.30M | 47.00M |
| Other stockholder equity | - | - | - | - | -3914.50M |
| Property plant equipment | - | - | - | - | 4902.30M |
| Total current assets | 2591.50M | 2403.70M | 2153.30M | 2155.00M | 2182.30M |
| Net tangible assets | - | - | - | - | 2721.20M |
| Short term investments | 7.00M | 284.20M | 7.60M | 13.00M | 8.80M |
| Net receivables | 186.60M | 139.70M | 302.00M | 280.60M | 140.30M |
| Long term debt | 661.20M | 589.30M | 891.60M | 1119.10M | 1482.50M |
| Inventory | 981.40M | 843.90M | 776.90M | 764.40M | 706.10M |
| Accounts payable | 1051.90M | 796.30M | 762.30M | 2048.80M | 1070.50M |
| Non current assets total | 7523.30M | 6417.70M | 6528.90M | 6942.80M | 7261.10M |
| Capital lease obligations | 2750.00M | 2227.40M | 2211.50M | 2281.60M | 2278.70M |
| Breakdown | 2026-03-31 | 2025-03-31 | 2024-03-31 | 2023-03-31 | 2022-03-31 |
|---|---|---|---|---|---|
| Type | yearly | yearly | yearly | yearly | yearly |
| Date | 2026-03-31 | 2025-03-31 | 2024-03-31 | 2023-03-31 | 2022-03-31 |
| Investments | 255.50M | -289.10M | -1.90M | -516.60M | -35.10M |
| Change to liabilities | - | - | - | 82.10M | 289.10M |
| Total cashflows from investing activities | - | - | - | - | -245.70M |
| Net borrowings | -108.00M | -187.80M | -395.60M | - | -379.60M |
| Total cash from financing activities | - | - | - | - | -595.90M |
| Change to operating activities | - | - | - | - | 289.10M |
| Net income | 259.40M | 295.70M | 431.20M | 363.40M | 306.60M |
| Change in cash | 135.20M | -156.70M | -43.40M | -130.50M | 528.20M |
| Begin period cash flow | 864.50M | 1022.40M | 1067.90M | 1197.90M | 669.70M |
| End period cash flow | 997.20M | 864.50M | 1022.40M | 1067.90M | 1197.90M |
| Total cash from operating activities | 1176.00M | 1313.00M | 1301.70M | 1029.90M | 1378.00M |
| Issuance of capital stock | 12.00M | 15.80M | 57.00M | 0.00M | 0.30M |
| Depreciation | 650.70M | 542.60M | 526.30M | 448.30M | 383.20M |
| Other cashflows from investing activities | - | - | - | - | 7.40M |
| Dividends paid | 77.00M | 60.50M | 19.60M | - | - |
| Change to inventory | -79.30M | -73.30M | -31.30M | -58.50M | -46.50M |
| Change to account receivables | - | - | - | -33.70M | -2.90M |
| Sale purchase of stock | -21.10M | -81.30M | -83.10M | -0.10M | 0.00M |
| Other cashflows from financing activities | - | - | - | - | -216.60M |
| Change to netincome | - | - | - | 141.90M | 355.50M |
| Capital expenditures | 627.10M | 506.90M | 429.30M | 410.30M | 192.80M |
| Change in working capital | -153.90M | -38.60M | 77.20M | -10.10M | 239.70M |
| Stock based compensation | 38.80M | 52.40M | 48.30M | 38.00M | 38.80M |
| Other non cash items | 172.10M | 112.50M | 41.70M | 39.40M | 180.50M |
| Free cash flow | 548.90M | 806.10M | 872.40M | 619.60M | 1120.60M |
Sector: Consumer Cyclical Industry: Department Stores
|
Stock Name
|
Change
(USD) |
Price
(USD) |
Trailing
PE (x) |
Forward
PE (x) |
Price Sales
TTM (x) |
Price to Book Value (x)
|
Enterprise Value
to Revenue (x) |
Enterprise Value
to EBITDA (x) |
|---|---|---|---|---|---|---|---|---|
| MAKSY Marks & Spencer Group Plc |
0.39 3.29% |
12.24 | 30.82 | 14.31 | 0.60 | 2.57 | 0.59 | 7.83 |
| AONNF Aeon Co. Ltd |
- -% |
8.39 | 70.65 | - | 0.00 | 4.32 | 0.62 | 10.31 |
| AONNY Aeon Co Ltd ADR |
-0.13 1.59% |
8.03 | 63.29 | 5.93 | 0.00 | 3.86 | 0.62 | 10.31 |
| RYKKY Ryohin Keikaku Co Ltd |
- -% |
15.40 | 37.11 | 17.86 | 0.02 | 5.61 | 2.47 | 17.47 |
| SVTMF SM Investments Corporation |
- -% |
9.00 | 7.32 | 6.56 | 0.02 | 0.97 | 1.72 | 5.65 |
Marks and Spencer Group plc operates various retail stores. It operates through Fashion, Home & Beauty; Food; International; and Ocado segments. The company offers womenswear, menswear, lingerie, kids wear, beauty, and home products through UK and ROI, retail stores, and online. It also provides meat, fish, protein deli and dairy; produce and floral; meals, frozen, and food on the move; core basket; beers, wines, and spirits; and impulse and events, and hospitality services. In addition, it operates international franchises; and provides banking services. The company also exports its products. The company was founded in 1884 and is based in London, the United Kingdom.

Waterside House, London, United Kingdom, W2 1NW

44 20 7935 4422

51405
| Name | Title | Year Born |
|---|---|---|
| Mr. Eoin P. Tonge B Eng, B.E. | Director | 1972 |
| Mr. Stuart B. Machin | Chief Exec. Officer & Director | 1970 |
| Ms. Katie Bickerstaffe | Co-Chief Exec. & Director | 1967 |
| Mr. Jeremy Townsend | Interim Chief Financial Officer | 1964 |
| Mr. Fraser Ramzan | Head of Investor Relations | NA |
| Mr. Nick Folland | Group Gen. Counsel & Company Sec. | 1965 |
| Mr. Paul Friston | Managing Director of International | NA |
| Mr. Craig Taylor | Head of Operations for Food Supply Chain | NA |
| Michelle Ojulah | Head of Kidswear Buying | NA |
| Ms. Katharine Haenelt | First Head of Trading for Meat, Fish, Poultry & Dairy | NA |
Disclaimer - (*)This information, including any data, is sourced from Unicorn Data Services SAS, trading as EOD Historical Data (“EODHD”) on an ‘as is’ basis, using their API. We cannot guarantee the completeness or validity of the information and data provided on this page, as well as via the API. In some cases, the data may include analyst ratings or recommendations sourced through the EODHD API, which are intended solely for general information purposes.
This information does not consider your personal objectives, financial situation, or needs. Kalkine is not liable for any errors or omissions in the information provided or for any actions taken in reliance on it. You should seek advice from a financial adviser, stockbroker or other professional adviser (including taxation and legal advice) as necessary before acting on this information.

Download a free report with stock ideas and industry insights for general information.
Download Free Report Now →


Basic Materials
 -1.26%
Communication Services
-0.18%

Consumer Cyclical
-0.36%

Consumer Defensive
 +0.07%

Energy
-0.01%

Financial Services
-0.26%
Financials
-2.20%

Healthcare
-0.55%

Industrials
-0.08%

Real Estate
-0.33%

Technology
-0.70%

Utilities
-0.41%
Note: Daily price change (%) by sector excluding stocks with +/-90% daily price change. Companies above $500 million market capitalization are considered.
 Portfolio
 Watchlist


 Please wait processing your request...