 CA
 NZ
 UK
 AU
 IND

 US


…
Konecranes Plc manufactures, sells, and services lifting equipment. It operates through three segments: Service, Industrial Equipment, and Port Solutions. The company offers specialized maintenance services and spare parts for industrial cranes and hoists. In addition, it provides a range of industrial cranes for general manufacturing and various process industries, as well as involved in design and manufacture of crane components. Further, the company offers container, bulk, and shipyard handling equipment, as well as mobile harbor cranes, lift trucks. Additionally, it engages in port services comprising of retrofits, inspection, spare parts, training, and digital services. Furthermore, the company is involved in consulting and engineering, ecolifting, safety assist, servicing, and maintenance of ports, and cores for lifting. The company serves automotive, container handling, general manufacturing, intermodal, metal production, mining, nuclear, paper and forest, petroleum and gas, power, shipyards, waste to energy and biomass sectors. Konecranes Plc was founded in 1910 and is headquartered in Hyvinkää, Finland.
Source: TradingView
The charts and visual representations are sourced from TradingView through embedded widgets. For any issues with chart display, please visit the TradingView website
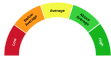
A unique technical analysis driven score developed by Kalkine showing momentum in stock prices based on select technical indicators identified.
Konecranes Abp (ADR) designs, manufactures and services industrial and port lifting equipment including cranes, hoists and related aftermarket solutions; long-term growth is supported by recurring service revenue from a large installed base, increased automation and electrification, and infrastructure and port investment. Investors may find it attractive because its service-heavy model and global operations could support relatively steady, recurring cash flows.
Key risks include sensitivity to cyclical capital spending and trade volumes, competitive pressure in equipment markets, and operational exposure to supply-chain disruption, raw-material cost swings and currency volatility.

Note: The summary and risk score provided above is created by AI and should not be construed as a recommendation of Kalkine.


| Breakdown | 2022-12-31 | 2021-12-31 | 2020-12-31 | 2019-12-31 | 2018-12-31 |
|---|---|---|---|---|---|
| Type | yearly | yearly | yearly | yearly | yearly |
| Date | 2022-12-31 | 2021-12-31 | 2020-12-31 | 2019-12-31 | 2018-12-31 |
| Income before tax | 190.70M | 192.50M | 170.40M | 118.50M | 138.70M |
| Minority interest | 1.80M | -0.50M | 9.10M | 9.20M | 18.40M |
| Net income | 140.30M | 146.90M | 122.20M | 81.00M | 101.80M |
| Selling general administrative | - | - | - | 1080.70M | 1006.50M |
| Gross profit | 1845.70M | 1765.80M | 1699.90M | 1818.60M | 1781.90M |
| Reconciled depreciation | 124.40M | 120.10M | 130.00M | 123.60M | 119.90M |
| Ebit | 223.20M | 220.00M | 173.80M | 148.70M | 182.20M |
| Ebitda | 374.10M | 362.70M | 324.60M | 272.90M | 302.10M |
| Depreciation and amortization | 150.90M | 142.70M | 150.80M | 124.20M | 119.90M |
| Non operating income net other | - | - | - | - | 0.00M |
| Operating income | 223.20M | 220.00M | 173.80M | 148.70M | 166.20M |
| Other operating expenses | 3132.30M | 2965.60M | 3005.20M | 3177.30M | 2976.20M |
| Interest expense | 26.50M | 19.00M | 24.10M | 21.70M | 23.70M |
| Tax provision | 52.20M | 45.10M | 47.50M | 35.70M | 40.40M |
| Interest income | 6.10M | 2.10M | 1.50M | 2.50M | 1.70M |
| Net interest income | -26.00M | -22.60M | -28.60M | -34.70M | -26.40M |
| Extraordinary items | - | - | - | - | 0.00M |
| Non recurring | - | - | - | - | 0.00M |
| Other items | - | - | - | - | 0.00M |
| Income tax expense | 52.20M | 45.10M | 47.50M | 35.70M | 40.40M |
| Total revenue | 3355.90M | 3178.90M | 3172.90M | 3323.60M | 3153.80M |
| Total operating expenses | 1622.10M | 1552.50M | 1532.20M | 1672.30M | 1604.30M |
| Cost of revenue | 1510.20M | 1413.10M | 1473.00M | 1505.00M | 1371.90M |
| Total other income expense net | -32.50M | -27.50M | -3.40M | -30.20M | -27.50M |
| Discontinued operations | - | - | - | - | 0.00M |
| Net income from continuing ops | 138.50M | 147.40M | 122.90M | 82.80M | 98.30M |
| Net income applicable to common shares | 140.30M | 146.90M | 122.20M | 81.00M | 101.80M |
| Preferred stock and other adjustments | - | - | - | - | 0.00M |
| Breakdown | 2022-12-31 | 2021-12-31 | 2020-12-31 | 2019-12-31 | 2018-12-31 |
|---|---|---|---|---|---|
| Type | yearly | yearly | yearly | yearly | yearly |
| Date | 2022-12-31 | 2021-12-31 | 2020-12-31 | 2019-12-31 | 2018-12-31 |
| Total assets | 4340.60M | 3845.80M | 4016.50M | 3854.20M | 3567.00M |
| Intangible assets | 475.30M | 503.10M | 536.00M | 531.60M | 582.80M |
| Other current assets | 77.10M | 816.60M | 757.50M | 852.00M | 787.80M |
| Total liab | 2907.60M | 2485.20M | 2765.40M | 2607.50M | 2282.80M |
| Total stockholder equity | 1432.90M | 1351.40M | 1242.00M | 1237.50M | 1265.80M |
| Deferred long term liab | - | - | - | - | 0.00M |
| Other current liab | 1124.80M | 11.20M | 12.70M | 13.20M | 808.30M |
| Common stock | 30.10M | 30.10M | 30.10M | 30.10M | 30.10M |
| Capital stock | 30.10M | 30.10M | 30.10M | 30.10M | 30.10M |
| Retained earnings | 535.80M | 455.30M | 367.50M | 353.40M | 391.20M |
| Other liab | 370.40M | 452.30M | 468.40M | 452.60M | 433.60M |
| Good will | 1019.60M | 1022.10M | 1016.70M | 908.20M | 906.10M |
| Other assets | 0.10M | 131.90M | 139.70M | 140.00M | -0.10M |
| Cash | 413.90M | 320.70M | 591.90M | 378.20M | 230.50M |
| Total current liabilities | 1480.80M | 1585.80M | 1437.30M | 1375.40M | 1264.60M |
| Current deferred revenue | - | 901.20M | 911.90M | 877.60M | 53.30M |
| Net debt | 692.30M | 544.40M | 579.00M | 656.00M | 545.90M |
| Short term debt | 49.80M | 418.00M | 311.10M | 248.40M | 191.80M |
| Short long term debt | 13.30M | 379.70M | 273.20M | 248.40M | 183.80M |
| Short long term debt total | 1106.20M | 865.10M | 1170.90M | 1034.20M | 776.40M |
| Other stockholder equity | 867.00M | 866.00M | 844.40M | 854.00M | 844.50M |
| Property plant equipment | 364.00M | 339.30M | 341.80M | 332.80M | 236.70M |
| Total current assets | 2369.10M | 1842.60M | 1975.80M | 1867.70M | 1636.60M |
| Long term investments | - | - | - | 73.90M | 71.00M |
| Net tangible assets | -62.10M | -173.80M | -310.70M | -202.30M | -222.30M |
| Short term investments | - | - | - | - | 0.00M |
| Net receivables | 585.60M | 735.00M | 661.20M | 770.10M | 719.30M |
| Long term debt | 952.40M | 362.00M | 768.90M | 785.80M | 572.50M |
| Inventory | 947.30M | 705.30M | 626.40M | 637.50M | 618.30M |
| Accounts payable | 306.20M | 255.40M | 201.60M | 236.20M | 211.20M |
| Total permanent equity | - | - | - | - | 0.00M |
| Noncontrolling interest in consolidated entity | - | - | - | - | 0.00M |
| Temporary equity redeemable noncontrolling interests | - | - | - | - | 0.00M |
| Accumulated other comprehensive income | - | - | - | - | 0.00M |
| Additional paid in capital | - | - | - | - | 0.00M |
| Common stock total equity | - | - | - | - | 0.00M |
| Preferred stock total equity | - | - | - | - | 0.00M |
| Retained earnings total equity | - | - | - | - | 0.00M |
| Treasury stock | - | - | - | - | 0.00M |
| Accumulated amortization | - | - | - | - | 0.00M |
| Non currrent assets other | 8.70M | 0.80M | 0.90M | 0.80M | 0.10M |
| Deferred long term asset charges | - | - | - | - | 0.00M |
| Non current assets total | 1971.40M | 2003.20M | 2040.70M | 1986.50M | 1930.50M |
| Capital lease obligations | 140.50M | 123.40M | 128.80M | 138.20M | 20.10M |
| Long term debt total | - | - | - | - | 0.00M |
| Breakdown | 2022-12-31 | 2021-12-31 | 2020-12-31 | 2019-12-31 | 2018-12-31 |
|---|---|---|---|---|---|
| Type | yearly | yearly | yearly | yearly | yearly |
| Date | 2022-12-31 | 2021-12-31 | 2020-12-31 | 2019-12-31 | 2018-12-31 |
| Investments | -43.60M | -30.70M | -165.10M | -23.20M | -35.00M |
| Change to liabilities | 0.00M | 0.00M | 0.00M | 0.00M | 0.00M |
| Total cashflows from investing activities | -43.60M | -30.70M | -165.10M | -23.20M | -35.00M |
| Net borrowings | 180.50M | -344.60M | 83.90M | 94.70M | 20.10M |
| Total cash from financing activities | 69.10M | -417.00M | -12.40M | -4.50M | -75.20M |
| Change to operating activities | 262.00M | -5.70M | -33.10M | 46.70M | -4.30M |
| Net income | 138.50M | 147.40M | 122.90M | 82.80M | 98.30M |
| Change in cash | 93.20M | -271.20M | 213.70M | 147.70M | -2.60M |
| Begin period cash flow | 320.70M | 591.90M | 378.20M | 230.50M | 233.10M |
| End period cash flow | 413.90M | 320.70M | 591.90M | 378.20M | 230.50M |
| Total cash from operating activities | 66.70M | 168.40M | 407.10M | 172.80M | 109.20M |
| Depreciation | 124.40M | 120.10M | 130.00M | 123.60M | 119.90M |
| Other cashflows from investing activities | - | - | - | - | -35.00M |
| Dividends paid | -98.90M | -69.60M | -95.00M | -94.60M | 94.60M |
| Change to inventory | -264.40M | -65.30M | 42.40M | -18.90M | -91.10M |
| Change to account receivables | -159.90M | -28.00M | 115.70M | -40.30M | 3.90M |
| Sale purchase of stock | - | - | - | - | 0.00M |
| Other cashflows from financing activities | 500.90M | -341.80M | 88.00M | 110.70M | 33.90M |
| Change to netincome | -26.50M | 0.40M | 29.90M | -18.50M | -7.20M |
| Capital expenditures | 44.70M | 40.50M | 43.80M | 40.70M | 38.30M |
| Change receivables | - | - | - | - | 0.00M |
| Cash flows other operating | - | - | - | - | 0.00M |
| Exchange rate changes | - | - | - | - | 0.00M |
| Cash and cash equivalents changes | - | - | - | - | 0.00M |
| Change in working capital | -162.30M | -99.00M | 125.00M | -12.50M | -91.50M |
| Other non cash items | -33.90M | -0.10M | 29.20M | -21.10M | -17.50M |
| Free cash flow | 66.70M | 127.90M | 363.30M | 132.10M | 70.90M |
Sector: Industrials Industry: Farm & Heavy Construction Machinery
|
Stock Name
|
Change
(USD) |
Price
(USD) |
Trailing
PE (x) |
Forward
PE (x) |
Price Sales
TTM (x) |
Price to Book Value (x)
|
Enterprise Value
to Revenue (x) |
Enterprise Value
to EBITDA (x) |
|---|---|---|---|---|---|---|---|---|
| KNCRY Konecranes Abp ADR |
- -% |
8.33 | 11.17 | 10.37 | 0.89 | 1.88 | 1.04 | 8.47 |
| CAT Caterpillar Inc |
-11.97 2.10% |
558.82 | 42.55 | 34.84 | 5.54 | 17.47 | 6.00 | 28.37 |
| DE Deere & Company |
- -% |
644.75 | 33.11 | 33.44 | 3.39 | 6.11 | 4.70 | 18.67 |
| PCAR PACCAR Inc |
-0.80 0.76% |
103.81 | 25.84 | 16.50 | 2.32 | 3.18 | 2.54 | 19.47 |
| VLVLY Volvo AB ADR |
-0.21 0.68% |
31.31 | 12.06 | 12.84 | 0.10 | 3.05 | 0.13 | 0.83 |
Konecranes Plc manufactures, sells, and services lifting equipment. It operates through three segments: Service, Industrial Equipment, and Port Solutions. The company offers specialized maintenance services and spare parts for industrial cranes and hoists. In addition, it provides a range of industrial cranes for general manufacturing and various process industries, as well as involved in design and manufacture of crane components. Further, the company offers container, bulk, and shipyard handling equipment, as well as mobile harbor cranes, lift trucks. Additionally, it engages in port services comprising of retrofits, inspection, spare parts, training, and digital services. Furthermore, the company is involved in consulting and engineering, ecolifting, safety assist, servicing, and maintenance of ports, and cores for lifting. The company serves automotive, container handling, general manufacturing, intermodal, metal production, mining, nuclear, paper and forest, petroleum and gas, power, shipyards, waste to energy and biomass sectors. Konecranes Plc was founded in 1910 and is headquartered in Hyvinkää, Finland.
| Name | Title | Year Born |
|---|---|---|
| Mr. Teo Ottola M.Sc (Econ.) | Chief Financial Officer | 1968 |
| Mr. Anders Svensson | Pres & CEO | 1975 |
| Ms. Anneli Karkovirta | Sr. VP of People & Culture and Member of Exec. Board | 1963 |
| Mr. Juha Matti Herman Pankakoski eMBA, M.Sc. (Eng.) | Exec. VP of Technology | 1967 |
| Ms. Kiira Froberg | VP of Investor Relations | NA |
| Ms. Sirpa Poitsalo LL.M. | Sr. VP, Gen. Counsel & Sec. of the Board | 1963 |
| Ms. Niina Suhonen M.Sc. | VP of Group Marketing and Communications | 1969 |
| Mr. Jukka Pentti Tapio Paasonen | Bus. Devel. Director of Customer Experience and Service Offering | 1963 |
| Mr. Tomas Myntti | Sr. VP of Industrial Service - Region EMEA (Europe, Middle East and Africa) | 1963 |
| Mr. Aku Lehtinen M.Sc. (Eng.) | Head of Region IMEA (India, Middle East & Africa) and Sr. VP | 1969 |
Disclaimer - (*)This information, including any data, is sourced from Unicorn Data Services SAS, trading as EOD Historical Data (“EODHD”) on an ‘as is’ basis, using their API. We cannot guarantee the completeness or validity of the information and data provided on this page, as well as via the API. In some cases, the data may include analyst ratings or recommendations sourced through the EODHD API, which are intended solely for general information purposes.
This information does not consider your personal objectives, financial situation, or needs. Kalkine is not liable for any errors or omissions in the information provided or for any actions taken in reliance on it. You should seek advice from a financial adviser, stockbroker or other professional adviser (including taxation and legal advice) as necessary before acting on this information.

Download a free report with stock ideas and industry insights for general information.
Download Free Report Now →


Basic Materials
 -1.68%
Communication Services
-0.30%

Consumer Cyclical
 +0.33%

Consumer Defensive
-0.02%

Energy
-1.06%

Financial Services
-0.51%
Financials
-0.83%

Healthcare
-0.33%

Industrials
-0.16%

Real Estate
+0.08%

Technology
+0.37%

Utilities
+0.09%
Note: Daily price change (%) by sector excluding stocks with +/-90% daily price change. Companies above $500 million market capitalization are considered.
 Portfolio
 Watchlist


 Please wait processing your request...