 CA
 NZ
 UK
 AU
 IND

 US


…
Kraig Biocraft Laboratories, Inc. engages in developing protein-based fibers using recombinant DNA technology for commercial applications in the technical textile and specialty fiber industries in the United States. Its primary proprietary fiber technology includes natural and engineered variants of spider silk produced in domesticated mulberry silkworms, as well as uses genetically engineered silkworms that produce spider silk proteins to create its recombinant spider silk. The company's products are used in military and police, and defense applications for ballistic protection; industrial applications, including critical cables and abrasion/impact resistant components; safety equipment; and composite materials for the aero-space industry. Its products are also used in various markets, such as medical textiles, geotextiles, defense and military textiles, safe and protective clothing, filtration textiles, composites with textile structure, and functional and sportive textiles, as well as textiles used in buildings and transportation. Kraig Biocraft Laboratories, Inc. was incorporated in 2006 and is headquartered in Ann Arbor, Michigan.
Source: TradingView
The charts and visual representations are sourced from TradingView through embedded widgets. For any issues with chart display, please visit the TradingView website
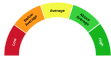
A unique technical analysis driven score developed by Kalkine showing momentum in stock prices based on select technical indicators identified.
Kraig Biocraft Labs develops genetically engineered spider silk fibers produced via transgenic silkworms for textile and industrial uses. Long-term growth may be driven by successful manufacturing scale-up, commercialization or licensing, and demand for sustainable, high-strength materials. The company may attract investors due to its proprietary technology and potential exposure to specialty fiber markets.
Material risks include early-stage commercialization, uncertain market adoption, manufacturing scale-up and significant financing and execution risk given limited operating history.

Note: The summary and risk score provided above is created by AI and should not be construed as a recommendation of Kalkine.


| Breakdown | 2022-12-31 | 2021-12-31 | 2020-12-31 | 2019-12-31 | 2018-12-31 |
|---|---|---|---|---|---|
| Type | yearly | yearly | yearly | yearly | yearly |
| Date | 2022-12-31 | 2021-12-31 | 2020-12-31 | 2019-12-31 | 2018-12-31 |
| Income before tax | -3.84M | -8.05M | -4.97M | -2.91M | -1.17M |
| Minority interest | - | - | - | - | 0.00M |
| Net income | -3.84M | -8.05M | -4.97M | -2.91M | -1.17M |
| Selling general administrative | 1.94M | 2.56M | 4.45M | 2.40M | 1.21M |
| Gross profit | - | - | - | - | 0.40M |
| Reconciled depreciation | 0.03M | 0.04M | 0.03M | 0.03M | 0.03M |
| Ebit | -2.12M | -2.76M | -4.53M | -2.62M | -0.96M |
| Ebitda | -3.20M | -2.64M | -4.56M | -2.58M | -0.91M |
| Non operating income net other | - | - | - | - | 0.00M |
| Operating income | -2.12M | -2.76M | -4.53M | -2.62M | -0.96M |
| Other operating expenses | - | - | - | - | 0.00M |
| Interest expense | 0.61M | 0.66M | 0.39M | 0.29M | 0.23M |
| Tax provision | 0.00M | 0.00M | 0.00M | 0.00M | 0.00M |
| Interest income | - | - | 0.00M | 0.01M | - |
| Net interest income | -1.72M | -5.36M | -0.44M | -0.29M | -0.23M |
| Extraordinary items | - | - | - | - | 0.00M |
| Non recurring | - | - | - | - | 0.00M |
| Other items | - | - | - | - | 0.00M |
| Income tax expense | - | - | - | - | 0.00M |
| Total revenue | 0.00M | 0.00M | 0.00M | 0.00M | 0.40M |
| Total operating expenses | 2.12M | 2.76M | 4.53M | 2.62M | 1.36M |
| Cost of revenue | - | - | - | - | 0.00M |
| Total other income expense net | 0.00M | 0.08M | - | - | 0.02M |
| Discontinued operations | - | - | - | - | 0.00M |
| Net income from continuing ops | -3.84M | -8.05M | -4.97M | -2.91M | -1.17M |
| Net income applicable to common shares | -3.84M | -8.05M | -4.97M | -2.91M | -1.17M |
| Preferred stock and other adjustments | - | - | - | - | 0.00M |
| Breakdown | 2022-12-31 | 2021-12-31 | 2020-12-31 | 2019-12-31 | 2018-12-31 |
|---|---|---|---|---|---|
| Type | yearly | yearly | yearly | yearly | yearly |
| Date | 2022-12-31 | 2021-12-31 | 2020-12-31 | 2019-12-31 | 2018-12-31 |
| Total assets | 4.57M | 3.02M | 1.28M | 0.75M | 0.07M |
| Intangible assets | - | - | - | - | 0.00M |
| Other current assets | - | - | - | - | 0.00M |
| Total liab | 8.09M | 8.32M | 7.85M | 6.14M | 4.53M |
| Total stockholder equity | -3.52M | -5.30M | -6.57M | -5.39M | -4.46M |
| Deferred long term liab | - | - | - | - | 0.00M |
| Other current liab | - | 0.35M | 0.33M | 0.30M | 0.25M |
| Common stock | 27.06M | 22.39M | 17.12M | 16.76M | 15.15M |
| Capital stock | 32.28M | 27.60M | 22.34M | 21.97M | 20.36M |
| Retained earnings | -46.66M | -42.81M | -34.77M | -29.80M | -26.89M |
| Other liab | - | - | - | - | 0.00M |
| Good will | - | - | - | - | 0.00M |
| Other assets | 0.00M | 0.00M | 0.00M | 0.00M | 0.00M |
| Cash | 3.86M | 2.36M | 0.82M | 0.13M | 0.01M |
| Total current liabilities | 8.07M | 8.16M | 7.45M | 5.58M | 4.53M |
| Net debt | - | - | 1.19M | 0.76M | 0.31M |
| Short term debt | - | - | - | 0.70M | 0.00M |
| Short long term debt | 1.71M | 2.22M | 1.86M | 0.70M | 0.32M |
| Other stockholder equity | 0.02M | 0.02M | 0.02M | 0.02M | 0.02M |
| Property plant equipment | 0.15M | 0.22M | 0.45M | 0.59M | 0.05M |
| Total current assets | 3.98M | 2.37M | 0.82M | 0.16M | 0.02M |
| Long term investments | 0.44M | 0.44M | - | - | 0.00M |
| Net tangible assets | -8.74M | -10.51M | -11.79M | -10.61M | -9.68M |
| Short term investments | - | - | - | - | 0.00M |
| Net receivables | - | - | - | - | 0.00M |
| Long term debt | - | 0.10M | 0.15M | 0.19M | 0.00M |
| Inventory | 0.01M | - | - | - | 0.00M |
| Accounts payable | 0.54M | 3.65M | 3.43M | 3.16M | 0.79M |
| Total permanent equity | - | - | - | - | 0.00M |
| Noncontrolling interest in consolidated entity | - | - | - | - | 0.00M |
| Temporary equity redeemable noncontrolling interests | - | - | - | - | 0.00M |
| Accumulated other comprehensive income | - | - | - | - | 0.00M |
| Additional paid in capital | - | - | - | - | 0.00M |
| Common stock total equity | - | - | - | - | 0.00M |
| Preferred stock total equity | - | - | - | - | 0.00M |
| Retained earnings total equity | - | - | - | - | 0.00M |
| Treasury stock | - | - | - | - | 0.00M |
| Accumulated amortization | - | - | - | - | 0.00M |
| Non currrent assets other | - | - | - | 0.59M | 0.05M |
| Deferred long term asset charges | - | - | - | - | 0.00M |
| Non current assets total | 0.59M | 0.66M | 0.46M | 0.59M | 0.05M |
| Capital lease obligations | 0.06M | 0.10M | 0.38M | 0.48M | 0.00M |
| Long term debt total | - | - | - | - | 0.00M |
| Breakdown | 2022-12-31 | 2021-12-31 | 2020-12-31 | 2019-12-31 | 2018-12-31 |
|---|---|---|---|---|---|
| Type | yearly | yearly | yearly | yearly | yearly |
| Date | 2022-12-31 | 2021-12-31 | 2020-12-31 | 2019-12-31 | 2018-12-31 |
| Investments | -0.01M | -0.45M | -0.45M | -0.45M | -0.45M |
| Change to liabilities | 0.14M | 0.20M | 0.04M | 0.31M | 0.14M |
| Total cashflows from investing activities | -0.01M | -0.55M | -0.55M | -0.10M | -0.01M |
| Net borrowings | 2.66M | 3.62M | 2.02M | 0.30M | 0.24M |
| Total cash from financing activities | 3.40M | 3.89M | 1.95M | 1.30M | 0.24M |
| Change to operating activities | 0.37M | 0.42M | 0.69M | 0.78M | 0.68M |
| Net income | -3.84M | -8.05M | -4.97M | -2.91M | -1.17M |
| Change in cash | 1.51M | 1.54M | 0.69M | 0.11M | -0.00M |
| Begin period cash flow | 2.36M | 0.82M | 0.13M | 0.01M | 0.02M |
| End period cash flow | 3.86M | 2.36M | 0.82M | 0.13M | 0.01M |
| Total cash from operating activities | -1.89M | -1.80M | -1.25M | -1.09M | -0.24M |
| Issuance of capital stock | - | 0.00M | 0.02M | 1.00M | 0.00M |
| Depreciation | 0.03M | 0.03M | 0.03M | 0.03M | 0.03M |
| Other cashflows from investing activities | - | - | - | - | 0.00M |
| Dividends paid | - | - | - | - | 0.00M |
| Change to inventory | -0.01M | -0.01M | -0.01M | -0.01M | 0.00M |
| Change to account receivables | - | - | - | 0.00M | 0.03M |
| Sale purchase of stock | - | - | - | - | 0.00M |
| Other cashflows from financing activities | - | - | -0.09M | -0.09M | -0.09M |
| Change to netincome | 0.32M | 0.90M | 2.90M | 0.70M | 0.06M |
| Capital expenditures | 0.01M | 0.10M | 0.10M | 0.10M | 0.01M |
| Change receivables | - | - | - | - | 0.00M |
| Cash flows other operating | - | - | - | - | 0.00M |
| Exchange rate changes | - | - | - | - | 0.00M |
| Cash and cash equivalents changes | - | - | - | - | 0.00M |
| Change in working capital | 0.50M | 0.62M | 0.73M | 1.09M | 0.84M |
| Other non cash items | 1.19M | 5.03M | 0.11M | 0.00M | 0.06M |
| Free cash flow | -1.89M | -1.90M | -1.25M | -1.19M | -0.25M |
Sector: Basic Materials Industry: Specialty Chemicals
|
Stock Name
|
Change
(USD) |
Price
(USD) |
Trailing
PE (x) |
Forward
PE (x) |
Price Sales
TTM (x) |
Price to Book Value (x)
|
Enterprise Value
to EBITDA (x) |
|---|---|---|---|---|---|---|---|
| KBLB Kraig Biocraft Labs |
- -% |
0.08 | - | - | 1199.03 | - | -21.22 |
| LIN Linde plc Ordinary Shares |
3.57 0.68% |
526.06 | 33.77 | 28.90 | 6.56 | 5.42 | 18.92 |
| AIQUY Air Liquide SA ADR |
-0.02 0.05% |
42.57 | 30.69 | 24.81 | 4.70 | 4.10 | 15.61 |
| AIQUF L'Air Liquide S.A |
2.55 1.20% |
214.85 | 29.78 | 22.68 | 4.54 | 3.98 | 15.90 |
| SHW Sherwin-Williams Co |
-1.50 0.43% |
349.89 | 33.33 | 27.40 | 3.38 | 20.60 | 21.36 |
Kraig Biocraft Laboratories, Inc. engages in developing protein-based fibers using recombinant DNA technology for commercial applications in the technical textile and specialty fiber industries in the United States. Its primary proprietary fiber technology includes natural and engineered variants of spider silk produced in domesticated mulberry silkworms, as well as uses genetically engineered silkworms that produce spider silk proteins to create its recombinant spider silk. The company's products are used in military and police, and defense applications for ballistic protection; industrial applications, including critical cables and abrasion/impact resistant components; safety equipment; and composite materials for the aero-space industry. Its products are also used in various markets, such as medical textiles, geotextiles, defense and military textiles, safe and protective clothing, filtration textiles, composites with textile structure, and functional and sportive textiles, as well as textiles used in buildings and transportation. Kraig Biocraft Laboratories, Inc. was incorporated in 2006 and is headquartered in Ann Arbor, Michigan.

2723 South State Street, Ann Arbor, MI, United States, 48104

734 619 8066

36
| Name | Title | Year Born |
|---|---|---|
| Mr. Kim Kraig Thompson | Founder, Chairman, CEO, Pres, CFO & Corp. Sec. | 1961 |
| Mr. Jonathan R. Rice | Chief Operating Officer | 1980 |
| Mr. Kenneth Le | Director of Gov. Relations & Pres of Prodigy Textiles | 1966 |
| Dr. Trevor L. Kane | Chief Scientist & Member of Scientific Advisory Board | NA |
Disclaimer - (*)This information, including any data, is sourced from Unicorn Data Services SAS, trading as EOD Historical Data (“EODHD”) on an ‘as is’ basis, using their API. We cannot guarantee the completeness or validity of the information and data provided on this page, as well as via the API. In some cases, the data may include analyst ratings or recommendations sourced through the EODHD API, which are intended solely for general information purposes.
This information does not consider your personal objectives, financial situation, or needs. Kalkine is not liable for any errors or omissions in the information provided or for any actions taken in reliance on it. You should seek advice from a financial adviser, stockbroker or other professional adviser (including taxation and legal advice) as necessary before acting on this information.

Download a free report with stock ideas and industry insights for general information.
Download Free Report Now →


Basic Materials
 -1.01%
Communication Services
 +0.38%

Consumer Cyclical
+0.01%

Consumer Defensive
+0.56%

Energy
+0.45%

Financial Services
+0.07%
Financials
-0.27%

Healthcare
-0.36%

Industrials
-0.46%

Real Estate
+0.07%

Technology
-1.02%

Utilities
+0.24%
Note: Daily price change (%) by sector excluding stocks with +/-90% daily price change. Companies above $500 million market capitalization are considered.
 Portfolio
 Watchlist


 Please wait processing your request...