 CA
 NZ
 UK
 AU
 IND

 US


…
Intermap Technologies Corporation, a geospatial intelligence company, provides various geospatial solutions and analytics in the United States, the Asia Pacific, and Europe. The company offers core digital map products comprising digital surface model, a digital elevation model that measures the top surface of the earth and objects located on it; digital terrain model, a geometrically correct reference frame over which other data layers, such as aerial photography and other types of images; multi-frequency orthorectified radar imagery, which provides terrain features, including roads, trees, and buildings for other mapping applications such as topographic line maps; and NEXTMap One, a precision, 3D geospatial data at an unprecedented 1-meter resolution. It also provides additional mapping and image products, such as custom contours, terrain-derived hydrology datasets, terrain-derived coastline datasets, slope maps, aspect maps, hillshade images, contours, clutter, and land cover. In addition, the company offers Data-as-a-Service (DaaS) solutions, which include InsitePro, a configurable insurance underwriting software; NEXTView, a configurable data solution that delivers terrain and obstacle awareness for airborne safety; and aquarius software and solutions. Further, the company provides geospatial data acquisition and production services; value-added data licensing; pricing; and software solutions and services. The company's products are used in various applications comprising location-based information, geospatial risk assessment, geographic information systems, engineering, utilities, global positioning systems maps, oil and gas, renewable energy, hydrology, environmental planning, wireless communications, transportation, advertising, and 3D visualization. Intermap Technologies Corporation was founded in 1919 and is headquartered in Englewood, Colorado.
Source: TradingView
The charts and visual representations are sourced from TradingView through embedded widgets. For any issues with chart display, please visit the TradingView website
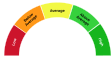
A unique technical analysis driven score developed by Kalkine showing momentum in stock prices based on select technical indicators identified.
Intermap Technologies provides high-resolution digital elevation data and geospatial analytics used by government and commercial customers for infrastructure planning, flood and risk modeling, telecom siting and mapping. Long-term growth may be supported by rising demand for elevation datasets, cloud-based analytics, broader climate- and infrastructure-focused modeling needs and international data licensing, and the company appears positioned to monetize recurring data and services which may appeal to investors seeking exposure to geospatial information services.
Primary risks include small-market OTC listing and limited liquidity, competition from satellite and LiDAR providers, revenue concentration and contract execution uncertainty that could affect financial stability.

Note: The summary and risk score provided above is created by AI and should not be construed as a recommendation of Kalkine.


| Breakdown | 2025-12-31 | 2024-12-31 | 2023-12-31 | 2022-12-31 | 2021-12-31 |
|---|---|---|---|---|---|
| Type | yearly | yearly | yearly | yearly | yearly |
| Date | 2025-12-31 | 2024-12-31 | 2023-12-31 | 2022-12-31 | 2021-12-31 |
| Income before tax | -6.69M | 2.46M | -3.64M | -5.29M | -3.34M |
| Net income | -6.71M | 2.46M | -3.70M | -5.28M | -3.36M |
| Selling general administrative | - | - | 6.98M | 7.41M | 6.35M |
| Gross profit | -4.08M | 5.06M | -1.54M | 3.98M | 2.87M |
| Reconciled depreciation | 1.40M | 1.09M | 1.18M | 1.77M | 1.76M |
| Ebit | - | - | - | - | -5.24M |
| Ebitda | - | - | - | -3.46M | -1.51M |
| Operating income | -6.93M | 2.54M | -3.34M | -5.21M | -4.11M |
| Interest expense | 0.10M | 0.09M | 0.06M | 0.06M | 0.06M |
| Tax provision | 0.02M | 0.00M | 0.06M | -0.00M | 0.02M |
| Interest income | 0.05M | 0.04M | 0.00M | 0.01M | 0.00M |
| Net interest income | -0.05M | -0.04M | -0.06M | -0.05M | -0.06M |
| Income tax expense | - | - | - | - | 0.02M |
| Total revenue | 10.57M | 17.64M | 6.20M | 6.79M | 5.80M |
| Total operating expenses | 17.50M | 15.10M | 9.54M | 12.00M | 9.91M |
| Cost of revenue | 14.65M | 12.57M | 7.74M | 2.82M | 2.93M |
| Total other income expense net | 0.30M | -0.03M | -0.24M | -0.03M | 0.83M |
| Net income from continuing ops | -6.71M | 2.46M | -3.70M | -5.28M | -3.36M |
| Net income applicable to common shares | - | - | - | - | -3.36M |
| Breakdown | 2025-12-31 | 2024-12-31 | 2023-12-31 | 2022-12-31 | 2021-12-31 |
|---|---|---|---|---|---|
| Type | yearly | yearly | yearly | yearly | yearly |
| Date | 2025-12-31 | 2024-12-31 | 2023-12-31 | 2022-12-31 | 2021-12-31 |
| Total assets | 31.73M | 11.94M | 4.54M | 6.33M | 7.45M |
| Intangible assets | 1.12M | 0.85M | 0.98M | 1.02M | 1.12M |
| Total liab | 7.17M | 8.20M | 8.10M | 7.75M | 6.60M |
| Total stockholder equity | 24.56M | 3.74M | -3.56M | -1.42M | 0.85M |
| Other current liab | - | - | - | - | 1.73M |
| Common stock | - | - | - | - | 206.10M |
| Capital stock | 242.44M | 213.53M | 209.30M | 208.41M | 206.10M |
| Retained earnings | -244.73M | -238.02M | -240.48M | -236.78M | -231.50M |
| Other assets | - | - | - | - | 0.04M |
| Cash | 22.52M | 0.45M | 0.68M | 0.84M | 0.19M |
| Total current liabilities | 5.08M | 7.47M | 7.41M | 6.95M | 5.64M |
| Net debt | - | 0.30M | - | - | 0.49M |
| Short long term debt | 0.30M | 0.26M | 0.15M | 0.14M | 0.01M |
| Other stockholder equity | - | - | - | - | 0.10M |
| Property plant equipment | - | - | - | - | 2.98M |
| Total current assets | 25.66M | 6.99M | 1.30M | 2.52M | 2.25M |
| Long term investments | 0.86M | 0.78M | 0.85M | 1.01M | 1.06M |
| Net tangible assets | - | - | - | - | -0.27M |
| Net receivables | 1.95M | 3.27M | 0.28M | 1.27M | 1.59M |
| Long term debt | 1.11M | 0.48M | 0.49M | 0.62M | 0.67M |
| Accounts payable | 1.44M | 2.61M | 2.43M | 1.93M | 1.97M |
| Non current assets total | 6.06M | 4.95M | 3.24M | 3.81M | 5.20M |
| Capital lease obligations | 0.56M | 0.45M | 0.46M | 0.40M | 0.54M |
| Breakdown | 2025-12-31 | 2024-12-31 | 2023-12-31 | 2022-12-31 | 2021-12-31 |
|---|---|---|---|---|---|
| Type | yearly | yearly | yearly | yearly | yearly |
| Date | 2025-12-31 | 2024-12-31 | 2023-12-31 | 2022-12-31 | 2021-12-31 |
| Investments | - | -2.25M | -0.42M | -0.24M | -1.39M |
| Change to liabilities | - | - | - | - | 0.65M |
| Total cashflows from investing activities | - | - | - | - | -1.39M |
| Net borrowings | -0.77M | -0.54M | -0.50M | - | -0.32M |
| Total cash from financing activities | 26.59M | 3.80M | 0.83M | 2.41M | 2.27M |
| Change to operating activities | - | - | - | - | -0.03M |
| Net income | -6.71M | 2.46M | -3.70M | -5.28M | -3.36M |
| Change in cash | 22.08M | -0.23M | -0.17M | 0.66M | -1.59M |
| Begin period cash flow | 0.45M | 0.68M | 0.84M | 0.19M | 1.78M |
| End period cash flow | 22.52M | 0.45M | 0.68M | 0.84M | 0.19M |
| Total cash from operating activities | -4.13M | -1.79M | -0.60M | -1.51M | -2.49M |
| Issuance of capital stock | 29.34M | 2.44M | 1.52M | 2.88M | 2.98M |
| Depreciation | 1.40M | 1.09M | 1.18M | 1.77M | 1.76M |
| Change to account receivables | 1.28M | -3.06M | 0.98M | -0.39M | -0.63M |
| Other cashflows from financing activities | - | - | - | - | -0.39M |
| Change to netincome | - | - | - | - | -0.89M |
| Capital expenditures | 0.96M | 2.25M | 0.42M | 0.24M | 1.12M |
| Change in working capital | 1.61M | -5.75M | 1.37M | 1.51M | -0.01M |
| Stock based compensation | 0.27M | 0.40M | 0.30M | 0.41M | 0.15M |
| Other non cash items | 0.10M | 0.09M | 0.06M | 0.03M | 0.04M |
| Free cash flow | -5.09M | -4.04M | -1.02M | -1.75M | -3.88M |
Sector: Technology Industry: Software - Application
|
Stock Name
|
Change
(USD) |
Price
(USD) |
Trailing
PE (x) |
Forward
PE (x) |
Price Sales
TTM (x) |
Price to Book Value (x)
|
Enterprise Value
to Revenue (x) |
Enterprise Value
to EBITDA (x) |
|---|---|---|---|---|---|---|---|---|
| ITMSF Intermap Technologies Corp |
0.01 1.85% |
0.54 | - | 4.90 | 6.99 | 2.86 | 5.28 | 68.20 |
| SAP SAP SE ADR |
- -% |
233.74 | 28.16 | 22.42 | 6.52 | 4.85 | 5.60 | 16.61 |
| CRM Salesforce Inc |
-1.46 0.68% |
213.48 | 23.41 | 15.55 | 4.79 | 5.56 | 5.55 | 14.88 |
| SAPGF SAP SE |
-5.80 2.44% |
232.20 | 76.28 | 22.88 | 5.61 | 3.84 | 5.59 | 26.18 |
| SHOP Shopify Inc |
-5.46 3.59% |
146.60 | 90.18 | 53.19 | 12.70 | 13.17 | 12.23 | 67.86 |
Intermap Technologies Corporation, a geospatial intelligence company, provides various geospatial solutions and analytics in the United States, the Asia Pacific, and Europe. The company offers core digital map products comprising digital surface model, a digital elevation model that measures the top surface of the earth and objects located on it; digital terrain model, a geometrically correct reference frame over which other data layers, such as aerial photography and other types of images; multi-frequency orthorectified radar imagery, which provides terrain features, including roads, trees, and buildings for other mapping applications such as topographic line maps; and NEXTMap One, a precision, 3D geospatial data at an unprecedented 1-meter resolution. It also provides additional mapping and image products, such as custom contours, terrain-derived hydrology datasets, terrain-derived coastline datasets, slope maps, aspect maps, hillshade images, contours, clutter, and land cover. In addition, the company offers Data-as-a-Service (DaaS) solutions, which include InsitePro, a configurable insurance underwriting software; NEXTView, a configurable data solution that delivers terrain and obstacle awareness for airborne safety; and aquarius software and solutions. Further, the company provides geospatial data acquisition and production services; value-added data licensing; pricing; and software solutions and services. The company's products are used in various applications comprising location-based information, geospatial risk assessment, geographic information systems, engineering, utilities, global positioning systems maps, oil and gas, renewable energy, hydrology, environmental planning, wireless communications, transportation, advertising, and 3D visualization. Intermap Technologies Corporation was founded in 1919 and is headquartered in Englewood, Colorado.

385 Inverness Parkway, Englewood, CO, United States, 80112

303 708 0955

102
| Name | Title | Year Born |
|---|---|---|
| Mr. Patrick A. F. Blott | Exec. Chairman & CEO | 1969 |
| Ms. Jennifer S. Bakken | Exec. VP of Fin. & CFO | NA |
| Dr. Jeremy Schneider | Chief Operating Officer | NA |
| Mr. Ralph Hope | Chief Technology Officer | NA |
| Dr. Carolyn Johnston Ph.D. | Chief Scientist | NA |
| Mr. Greg Hoffman | VP of HR | NA |
| Mr. Ivan Pierre Maddox | Exec. VP of Commercial Solutions | NA |
| Mr. Nigel D. Jackson | VP & Pres Director of PT Exsamap Asia | NA |
| Mr. Patrick A. F. Blott | Executive Chairman & CEO | 1969 |
| Ms. Jennifer S. Bakken | Executive VP of Finance & CFO | NA |
Disclaimer - (*)This information, including any data, is sourced from Unicorn Data Services SAS, trading as EOD Historical Data (“EODHD”) on an ‘as is’ basis, using their API. We cannot guarantee the completeness or validity of the information and data provided on this page, as well as via the API. In some cases, the data may include analyst ratings or recommendations sourced through the EODHD API, which are intended solely for general information purposes.
This information does not consider your personal objectives, financial situation, or needs. Kalkine is not liable for any errors or omissions in the information provided or for any actions taken in reliance on it. You should seek advice from a financial adviser, stockbroker or other professional adviser (including taxation and legal advice) as necessary before acting on this information.

Download a free report with stock ideas and industry insights for general information.
Download Free Report Now →


Basic Materials
 -1.26%
Communication Services
-0.18%

Consumer Cyclical
-0.36%

Consumer Defensive
 +0.07%

Energy
-0.01%

Financial Services
-0.26%
Financials
-2.20%

Healthcare
-0.55%

Industrials
-0.08%

Real Estate
-0.33%

Technology
-0.70%

Utilities
-0.41%
Note: Daily price change (%) by sector excluding stocks with +/-90% daily price change. Companies above $500 million market capitalization are considered.
 Portfolio
 Watchlist


 Please wait processing your request...