 CA
 NZ
 UK
 AU
 IND

 US


…
International Stem Cell Corporation, a clinical stage biotechnology company, focuses on the development of therapeutic and biomedical products in the United States, Asia, Europe, and internationally. It develops ISC- hpNSC, a neural stem cell program that has completed the Phase I clinical trial for the treatment of Parkinson's disease, as well as for treating stroke and traumatic brain injury. The company also offers anti-aging skin care products, including ProPlus Advanced Defense Complex, ProPlus Advanced Recovery Complex, ProPlus Eye Firming Complex, ProPlus Neck Firming Complex, ProPlus Advanced Aqueous Treatment, ProPlus Collagen Booster, ProPlus Elastin Booster, and ProPlus Brightening Toner. In addition, it provides human cell culture products comprising human skin cells and reagents for the study of skin disease, toxicology, or wound healing; human cells from the heart and blood vessels, and reagents to study cardiovascular disease and cancer; human bronchial and tracheal cell lines for the study of toxicity, cystic fibrosis, asthma, and pathogenesis; and human mammary epithelial cell lines for the study of breast cancer, three dimensional culture, and carcinogen screening. Its human cell culture products also comprise adult stem cells and reagents for regenerative medicine; human prostate cells and specialized medium to study prostate disease; human renal and bladder cells and media to study renal and bladder diseases; human corneal cells and media for the study of corneal disease; human female reproductive system cells for the study of cellular physiology; human skeletal muscle cells for the study of biology, diabetes, insulin receptor studies, muscle metabolism, muscle tissue repair, and myotube development; and other cell culture reagents and supplements for the growth, staining, and freezing of human cells. International Stem Cell Corporation was founded in 2001 and is headquartered in San Diego, California.
Source: TradingView
The charts and visual representations are sourced from TradingView through embedded widgets. For any issues with chart display, please visit the TradingView website
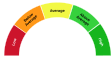
A unique technical analysis driven score developed by Kalkine showing momentum in stock prices based on select technical indicators identified.
International Stem Cell Corporation develops stem cell therapies and cell-derived products using parthenogenetic technology for regenerative medicine and cosmetic applications. Long-term growth drivers may include progress in R&D and regulatory milestones, commercialization or licensing of product lines, and broader adoption of regenerative treatments. Investors may find the company attractive for its differentiated platform and exposure to therapeutic and consumer markets, although outcomes depend on execution.
Material risks include early-stage execution and regulatory uncertainty, limited operating history and OTC liquidity, potential need for additional financing and competition from larger biotech firms.

Note: The summary and risk score provided above is created by AI and should not be construed as a recommendation of Kalkine.


| Breakdown | 2022-12-31 | 2021-12-31 | 2020-12-31 | 2019-12-31 | 2018-12-31 |
|---|---|---|---|---|---|
| Type | yearly | yearly | yearly | yearly | yearly |
| Date | 2022-12-31 | 2021-12-31 | 2020-12-31 | 2019-12-31 | 2018-12-31 |
| Income before tax | -0.33M | -0.90M | -2.72M | -4.26M | -2.13M |
| Net income | -0.33M | -0.90M | -2.72M | -4.26M | -2.13M |
| Selling general administrative | 4.60M | 5.47M | 6.18M | 9.88M | 8.10M |
| Gross profit | 4.91M | 4.24M | 4.35M | 5.54M | 7.02M |
| Reconciled depreciation | 0.22M | 0.26M | 0.25M | 0.28M | 0.31M |
| Ebit | - | -1.67M | -2.61M | -4.19M | -2.87M |
| Ebitda | 0.02M | -0.51M | -2.36M | -3.90M | -1.77M |
| Non operating income net other | - | - | 0.21M | 1.54M | - |
| Operating income | -0.18M | -1.92M | -2.82M | -5.73M | -3.47M |
| Interest expense | 0.14M | 0.13M | 0.11M | 0.08M | 0.05M |
| Tax provision | - | - | - | - | 0.00M |
| Net interest income | -0.14M | -0.13M | -0.11M | -0.08M | -0.05M |
| Total revenue | 8.18M | 7.18M | 7.13M | 9.47M | 11.09M |
| Total operating expenses | 8.36M | 9.10M | 7.17M | 15.20M | 14.56M |
| Cost of revenue | 3.27M | 2.94M | 2.78M | 3.93M | 4.07M |
| Total other income expense net | -0.01M | 1.15M | 0.21M | 1.54M | 1.39M |
| Net income from continuing ops | -0.33M | -0.90M | -2.72M | -4.26M | -2.13M |
| Net income applicable to common shares | - | -0.90M | -2.72M | -4.26M | -2.13M |
| Breakdown | 2022-12-31 | 2021-12-31 | 2020-12-31 | 2019-12-31 | 2018-12-31 |
|---|---|---|---|---|---|
| Type | yearly | yearly | yearly | yearly | yearly |
| Date | 2022-12-31 | 2021-12-31 | 2020-12-31 | 2019-12-31 | 2018-12-31 |
| Total assets | 5.13M | 4.95M | 5.29M | 6.62M | 7.80M |
| Intangible assets | 0.88M | 0.95M | 1.26M | 1.33M | 2.67M |
| Other current assets | 0.09M | 0.14M | 0.17M | 0.21M | - |
| Total liab | 9.65M | 9.53M | 5.32M | 9.51M | 5.26M |
| Total stockholder equity | -4.52M | -4.59M | -4.33M | -2.89M | 2.54M |
| Other current liab | 0.25M | 0.25M | 0.74M | 0.25M | 2.00M |
| Common stock | - | 0.01M | 0.01M | 0.01M | 0.01M |
| Capital stock | 0.01M | 0.01M | 0.01M | 0.01M | 0.01M |
| Retained earnings | -110.34M | -110.01M | -109.11M | -106.39M | -106.66M |
| Other liab | - | - | - | 0.21M | 0.18M |
| Other assets | - | 0.41M | 0.43M | 0.45M | 0.88M |
| Cash | 0.74M | 0.17M | 0.69M | 0.48M | 1.07M |
| Total current liabilities | 4.63M | 4.28M | 1.48M | 1.91M | 5.08M |
| Net debt | 2.58M | 2.77M | 2.44M | 1.89M | 0.97M |
| Short long term debt | 3.33M | 2.94M | 0.14M | - | 2.04M |
| Property plant equipment | - | 1.25M | 0.53M | 1.39M | 0.47M |
| Total current assets | 2.96M | 2.33M | 2.18M | 3.45M | 3.77M |
| Net tangible assets | - | -5.54M | -1.30M | -4.23M | -0.14M |
| Net receivables | 0.75M | 0.84M | 0.40M | 1.51M | 0.65M |
| Long term debt | - | - | 2.99M | 2.37M | - |
| Inventory | 1.38M | 1.18M | 0.92M | 1.25M | 1.50M |
| Accounts payable | 0.32M | 0.51M | 0.75M | 0.65M | 0.46M |
| Common stock total equity | - | - | 0.01M | 0.01M | - |
| Preferred stock total equity | - | - | 0.01M | 0.01M | - |
| Retained earnings total equity | - | - | -109.11M | -106.39M | - |
| Non currrent assets other | 0.29M | 0.37M | 0.94M | 0.36M | 0.81M |
| Non current assets total | 2.17M | 2.61M | 2.73M | 3.17M | 4.03M |
| Capital lease obligations | 0.95M | 1.13M | 1.19M | 1.08M | - |
| Long term debt total | - | - | - | 0.21M | - |
| Breakdown | 2022-12-31 | 2021-12-31 | 2020-12-31 | 2019-12-31 | 2018-12-31 |
|---|---|---|---|---|---|
| Type | yearly | yearly | yearly | yearly | yearly |
| Date | 2022-12-31 | 2021-12-31 | 2020-12-31 | 2019-12-31 | 2018-12-31 |
| Investments | -0.01M | -0.04M | -0.11M | -0.49M | -0.66M |
| Change to liabilities | - | 0.15M | -0.55M | 0.27M | -0.09M |
| Total cashflows from investing activities | - | -0.04M | -0.11M | -0.49M | -0.66M |
| Net borrowings | - | 0.82M | 0.65M | 1.30M | 2.00M |
| Total cash from financing activities | 0.25M | 0.82M | 0.65M | 1.30M | 2.51M |
| Change to operating activities | - | -0.26M | -0.51M | 0.38M | 0.35M |
| Net income | -0.33M | -0.90M | -2.72M | -4.26M | -2.13M |
| Change in cash | 0.57M | -0.52M | 0.20M | -0.59M | 0.77M |
| Begin period cash flow | 0.17M | 0.69M | 0.48M | 1.07M | 0.30M |
| End period cash flow | 0.74M | 0.17M | 0.69M | 0.48M | 1.07M |
| Total cash from operating activities | 0.33M | -1.30M | -0.34M | -1.40M | -1.08M |
| Issuance of capital stock | - | - | - | 0.00M | 0.50M |
| Depreciation | 0.22M | 0.26M | 0.25M | 0.28M | 0.31M |
| Other cashflows from investing activities | - | - | -0.08M | -0.33M | -0.48M |
| Change to inventory | -0.11M | -0.27M | 0.32M | 0.12M | -0.29M |
| Change to account receivables | 0.10M | -0.44M | 1.11M | -0.86M | -0.19M |
| Sale purchase of stock | - | - | - | - | 0.66M |
| Other cashflows from financing activities | - | - | - | - | 1.85M |
| Change to netincome | - | 0.16M | 1.14M | 2.09M | 0.96M |
| Capital expenditures | 0.01M | 0.02M | 0.03M | 0.16M | 0.18M |
| Change receivables | - | - | 1.11M | -0.86M | -0.19M |
| Cash flows other operating | - | - | 0.12M | 0.96M | 0.35M |
| Cash and cash equivalents changes | - | - | 0.20M | -0.59M | 0.77M |
| Change in working capital | -0.23M | -0.82M | 0.62M | -0.16M | -0.21M |
| Stock based compensation | 0.40M | 0.64M | 1.28M | 2.09M | - |
| Other non cash items | 0.27M | 0.41M | 0.37M | 0.08M | 0.03M |
| Free cash flow | 0.32M | -1.34M | -0.45M | -1.89M | -1.74M |
Sector: Healthcare Industry: Biotechnology
|
Stock Name
|
Change
(USD) |
Price
(USD) |
Trailing
PE (x) |
Forward
PE (x) |
Price Sales
TTM (x) |
Price to Book Value (x)
|
Enterprise Value
to Revenue (x) |
Enterprise Value
to EBITDA (x) |
|---|---|---|---|---|---|---|---|---|
| ISCO International Stem Cell Corp |
- -% |
0.16 | 5.10 | - | 0.10 | - | 0.43 | 5.24 |
| NVO Novo Nordisk A/S |
-0.54 1.32% |
40.55 | 41.58 | 31.15 | 2.13 | 32.99 | 2.11 | 4.70 |
| VRTX Vertex Pharmaceuticals Inc |
-2.37 0.43% |
544.66 | 30.22 | 24.27 | 10.36 | 6.50 | 9.99 | 24.66 |
| REGN Regeneron Pharmaceuticals Inc |
-2.77 0.29% |
956.64 | 29.07 | 20.12 | 7.57 | 3.82 | 6.95 | 19.42 |
| ARGNF argenx SE |
- -% |
900.30 | 45.77 | 31.25 | 13.84 | 7.12 | 11.38 | 36.06 |
International Stem Cell Corporation, a clinical stage biotechnology company, focuses on the development of therapeutic and biomedical products in the United States, Asia, Europe, and internationally. It develops ISC- hpNSC, a neural stem cell program that has completed the Phase I clinical trial for the treatment of Parkinson's disease, as well as for treating stroke and traumatic brain injury. The company also offers anti-aging skin care products, including ProPlus Advanced Defense Complex, ProPlus Advanced Recovery Complex, ProPlus Eye Firming Complex, ProPlus Neck Firming Complex, ProPlus Advanced Aqueous Treatment, ProPlus Collagen Booster, ProPlus Elastin Booster, and ProPlus Brightening Toner. In addition, it provides human cell culture products comprising human skin cells and reagents for the study of skin disease, toxicology, or wound healing; human cells from the heart and blood vessels, and reagents to study cardiovascular disease and cancer; human bronchial and tracheal cell lines for the study of toxicity, cystic fibrosis, asthma, and pathogenesis; and human mammary epithelial cell lines for the study of breast cancer, three dimensional culture, and carcinogen screening. Its human cell culture products also comprise adult stem cells and reagents for regenerative medicine; human prostate cells and specialized medium to study prostate disease; human renal and bladder cells and media to study renal and bladder diseases; human corneal cells and media for the study of corneal disease; human female reproductive system cells for the study of cellular physiology; human skeletal muscle cells for the study of biology, diabetes, insulin receptor studies, muscle metabolism, muscle tissue repair, and myotube development; and other cell culture reagents and supplements for the growth, staining, and freezing of human cells. International Stem Cell Corporation was founded in 2001 and is headquartered in San Diego, California.

9745 Businesspark Avenue, San Diego, CA, United States, 92131

760 940 6383

29
| Name | Title | Year Born |
|---|---|---|
| Dr. Andrey Semechkin Ph.D. | Co-Chairman & CEO | 1960 |
| Dr. Russell Kern Ph.D. | Exec. VP, Chief Scientific Officer, Principal Financial Officer & Director | 1986 |
| Ms. Rebecca McGee M.B.A. | Pres of Lifeline Cell Technology | NA |
Disclaimer - (*)This information, including any data, is sourced from Unicorn Data Services SAS, trading as EOD Historical Data (“EODHD”) on an ‘as is’ basis, using their API. We cannot guarantee the completeness or validity of the information and data provided on this page, as well as via the API. In some cases, the data may include analyst ratings or recommendations sourced through the EODHD API, which are intended solely for general information purposes.
This information does not consider your personal objectives, financial situation, or needs. Kalkine is not liable for any errors or omissions in the information provided or for any actions taken in reliance on it. You should seek advice from a financial adviser, stockbroker or other professional adviser (including taxation and legal advice) as necessary before acting on this information.

Download a free report with stock ideas and industry insights for general information.
Download Free Report Now →


Basic Materials
 -1.40%
Communication Services
-0.45%

Consumer Cyclical
-0.55%

Consumer Defensive
-0.01%

Energy
-0.01%

Financial Services
-0.40%
Financials
-0.15%

Healthcare
-1.15%

Industrials
-0.46%

Real Estate
-0.29%

Technology
-1.22%

Utilities
-0.10%
Note: Daily price change (%) by sector excluding stocks with +/-90% daily price change. Companies above $500 million market capitalization are considered.
 Portfolio
 Watchlist


 +0.55%
 Please wait processing your request...