 CA
 NZ
 UK
 AU
 IND

 US


…
Hypera S.A. operates as a pharmaceutical company in Brazil. The company provides sweeteners products under the Adocyl, finn, and Zero-cal brands; analgesics and anti-inflammatories products under the Doril, Atroveran, Calminex, Alivium, Buscopan, Buscofem, geloll, Torsilax, Neosaldina, and naprohax brands; cold and flu remedies and decongestants products under BENEGRIO, Rinosoro, Blu, Neosoro, Coristina, APRACUR, and Fluviral brands. It offers antihistamines products under Alektos, Histamin, Polaramine, PredSim, and Desrinite brands; antiseptics products under Merthiolate brand; Herbal medicine products under Maracugina, Eparema, Tamarine, and Naturetti brands; gastrointestinal products under Dramin, Estomazil, Engov, Lacto-purga, gastrol, Epocler, Bifilax, and Pepsamar brands. In addition, the company provides generics products under neo quimica brand; skicare products under episol, epidrat, simple organic, and bioage brands; supplements and vitamins products Addera, Biotonico Fontoura, Colflex, and Vitasay brands; and other products under Nebacetin, Cepacol, ESCABIN, Mirrorelax, Ammy, Nesina, and Diprospan brands. The company was formerly known as Hypermarcas S.A. and changed its name to Hypera S.A. in February 2018. Hypera S.A. was founded in 1999 and is headquartered in São Paulo, Brazil.
Source: TradingView
The charts and visual representations are sourced from TradingView through embedded widgets. For any issues with chart display, please visit the TradingView website
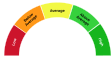
A unique technical analysis driven score developed by Kalkine showing momentum in stock prices based on select technical indicators identified.
Hypera S.A. is a Brazil-based pharmaceutical and consumer health company that develops, manufactures and markets prescription drugs, over-the-counter products and consumer brands domestically and in selected international markets. Long-term growth may be supported by Brazil's large healthcare market, portfolio diversification, scale in manufacturing and distribution, and expansion of branded generics and OTC channels.
Major risks include Brazilian macro and currency volatility, government pricing and regulatory actions, competitive pressure from generics and multinationals, and execution risks around new launches and acquisitions.

Note: The summary and risk score provided above is created by AI and should not be construed as a recommendation of Kalkine.


| Breakdown | 2025-12-31 | 2024-12-31 | 2023-12-31 | 2022-12-31 | 2021-12-31 |
|---|---|---|---|---|---|
| Type | yearly | yearly | yearly | yearly | yearly |
| Date | 2025-12-31 | 2024-12-31 | 2023-12-31 | 2022-12-31 | 2021-12-31 |
| Income before tax | 900.07M | 979.24M | 1509.47M | 1611.10M | 1644.33M |
| Minority interest | 5.24M | 10.12M | -3.20M | -1.70M | -0.10M |
| Net income | 1195.37M | 1340.99M | 1647.96M | 1696.70M | 1330.21M |
| Selling general administrative | 73.22M | 89.28M | 348.12M | 92.81M | 67.42M |
| Selling and marketing expenses | 2198.87M | 2036.55M | 2172.41M | 1760.19M | 1481.05M |
| Gross profit | 4545.51M | 4381.00M | 4995.54M | 4761.52M | 3802.89M |
| Reconciled depreciation | 317.22M | 281.06M | 218.66M | 169.10M | 133.69M |
| Ebit | 1943.74M | 1950.29M | 2638.62M | 2642.63M | 2036.29M |
| Ebitda | 2260.97M | 2231.34M | 2876.94M | 2811.74M | 2169.98M |
| Depreciation and amortization | 317.22M | 281.06M | 238.31M | 169.10M | 133.69M |
| Operating income | 1738.05M | 1795.77M | 2285.25M | 2642.63M | 2036.29M |
| Other operating expenses | 5961.11M | 5646.70M | 5629.41M | 5087.13M | 3985.21M |
| Interest expense | 1043.67M | 971.05M | 1349.52M | 986.08M | 383.22M |
| Tax provision | -290.75M | -353.76M | -117.97M | -95.35M | 26.58M |
| Interest income | 47.59M | 35.15M | 64.21M | 70.85M | 35.93M |
| Net interest income | -1082.12M | -1043.62M | -1193.61M | -1006.37M | -400.43M |
| Income tax expense | -290.75M | -353.76M | -141.64M | -95.35M | 26.58M |
| Total revenue | 7699.16M | 7442.47M | 7914.66M | 7546.35M | 5937.37M |
| Total operating expenses | 2807.46M | 2585.23M | 2710.30M | 2302.30M | 1850.72M |
| Cost of revenue | 3153.65M | 3061.47M | 2919.11M | 2784.83M | 2134.49M |
| Total other income expense net | -837.98M | -816.53M | -775.77M | -1031.53M | -391.96M |
| Discontinued operations | - | - | - | -8.05M | -287.44M |
| Net income from continuing ops | 1190.83M | 1333.00M | 1775.01M | 1706.45M | 1617.75M |
| Net income applicable to common shares | - | - | - | 1696.70M | 1330.21M |
| Breakdown | 2025-12-31 | 2024-12-31 | 2023-12-31 | 2022-12-31 | 2021-12-31 |
|---|---|---|---|---|---|
| Type | yearly | yearly | yearly | yearly | yearly |
| Date | 2025-12-31 | 2024-12-31 | 2023-12-31 | 2022-12-31 | 2021-12-31 |
| Total assets | 25158.00M | 24559.08M | 24508.75M | 23755.63M | 19817.96M |
| Intangible assets | 4716.64M | 4450.52M | 4092.74M | 3729.66M | 2630.37M |
| Other current assets | 629.05M | 749.28M | 663.00M | 391.06M | 232.35M |
| Total liab | 12633.63M | 12457.26M | 12990.88M | 13100.19M | 9984.49M |
| Total stockholder equity | 12522.03M | 12096.28M | 11504.12M | 10645.76M | 9826.59M |
| Deferred long term liab | - | - | - | 858.61M | 568.87M |
| Other current liab | 2038.68M | 1477.58M | 1409.09M | 1616.79M | 1383.28M |
| Common stock | 9705.89M | 9705.89M | 4478.13M | 4478.13M | 4478.13M |
| Capital stock | 9705.89M | 9705.89M | 4478.13M | 4478.13M | 4478.13M |
| Retained earnings | 1065.34M | 1509.48M | 6135.13M | 5266.25M | 4360.24M |
| Other liab | - | - | - | 405.28M | 345.39M |
| Good will | 7340.33M | 7340.33M | 7339.10M | 7365.81M | 7366.79M |
| Other assets | - | - | -2817.25M | 30.66M | 1691.90M |
| Cash | 1645.54M | 1739.33M | 2580.89M | 2862.47M | 2287.06M |
| Total current liabilities | 4110.97M | 3940.09M | 4644.24M | 5225.19M | 2776.53M |
| Current deferred revenue | - | - | 700.73M | - | - |
| Net debt | 7691.91M | 7658.04M | 7380.94M | 6818.50M | 5119.31M |
| Short term debt | 1329.91M | 1409.00M | 2141.00M | 2298.76M | 602.49M |
| Short long term debt | 1329.91M | 1409.00M | 2141.00M | 2298.76M | 565.65M |
| Short long term debt total | 9337.45M | 9397.37M | 9961.84M | 9680.97M | 7406.37M |
| Other stockholder equity | -12.39M | -22.83M | -20.28M | 6167.63M | 5348.47M |
| Property plant equipment | - | - | - | 2814.54M | 2095.14M |
| Total current assets | 6048.36M | 6681.88M | 8077.77M | 8530.12M | 6491.63M |
| Net tangible assets | - | - | - | 408.89M | 398.30M |
| Short term investments | - | - | 161.43M | - | -518.29M |
| Net receivables | 1694.59M | 2254.67M | 2642.15M | 3080.61M | 2668.74M |
| Long term debt | 8007.54M | 7988.36M | 7820.84M | 7382.21M | 6795.34M |
| Inventory | 2079.18M | 1938.60M | 2191.73M | 2195.98M | 1303.48M |
| Accounts payable | 575.41M | 984.14M | 389.67M | 1309.65M | 790.76M |
| Accumulated other comprehensive income | 1761.77M | 903.74M | 911.14M | - | - |
| Non currrent assets other | 204.01M | 366.45M | 1317.88M | 712.33M | 249.62M |
| Non current assets total | 19109.64M | 17877.21M | 16430.99M | 15225.51M | 13326.33M |
| Breakdown | 2025-12-31 | 2024-12-31 | 2023-12-31 | 2022-12-31 | 2021-12-31 |
|---|---|---|---|---|---|
| Type | yearly | yearly | yearly | yearly | yearly |
| Date | 2025-12-31 | 2024-12-31 | 2023-12-31 | 2022-12-31 | 2021-12-31 |
| Investments | - | -592.44M | -847.86M | -1742.34M | -4412.43M |
| Change to liabilities | - | - | - | 91.67M | 28.88M |
| Total cashflows from investing activities | -689.50M | -592.44M | -791.19M | -1742.34M | -4412.43M |
| Net borrowings | -240.19M | -757.48M | 296.71M | 2010.27M | 1701.50M |
| Total cash from financing activities | -1978.71M | -2788.73M | -1886.38M | 278.95M | 557.06M |
| Change to operating activities | - | - | - | 464.39M | 275.04M |
| Net income | 899.18M | 975.51M | 1506.99M | 1597.82M | 1209.33M |
| Change in cash | -93.79M | -841.57M | -281.58M | 575.41M | -2456.24M |
| Begin period cash flow | 1739.33M | 2580.89M | 2862.47M | 2287.06M | 4743.30M |
| End period cash flow | 1645.54M | 1739.33M | 2580.89M | 2862.47M | 2287.06M |
| Total cash from operating activities | 2574.43M | 2539.60M | 2395.99M | 2038.79M | 1399.13M |
| Issuance of capital stock | 10.55M | 13.25M | 81.59M | 84.31M | 18.69M |
| Depreciation | 317.22M | 281.06M | 230.28M | 169.10M | 133.69M |
| Other cashflows from investing activities | -137.32M | -150.16M | -202.94M | -5.80M | 168.57M |
| Dividends paid | 627.78M | 787.29M | 759.88M | -806.21M | -745.94M |
| Change to inventory | -312.34M | 80.12M | -90.97M | -961.65M | -405.54M |
| Change to account receivables | 555.19M | 536.13M | 243.00M | -471.37M | -511.81M |
| Sale purchase of stock | -23.09M | -55.81M | -88.45M | -87.00M | -128.67M |
| Other cashflows from financing activities | -1098.20M | -1201.40M | -1374.24M | 1552.58M | 1932.65M |
| Change to netincome | - | - | - | 854.25M | 684.09M |
| Capital expenditures | 799.36M | 772.27M | 812.71M | 1509.46M | 838.88M |
| Change in working capital | 378.41M | 696.24M | -467.66M | -726.52M | -743.88M |
| Stock based compensation | 22.98M | 33.20M | 46.20M | 24.88M | 24.95M |
| Other non cash items | 956.63M | 553.59M | 1080.19M | 973.52M | 314.93M |
| Free cash flow | 1775.07M | 1767.33M | 1583.28M | 529.34M | 560.25M |
Sector: Healthcare Industry: Drug Manufacturers - Specialty & Generic
|
Stock Name
|
Change
(USD) |
Price
(USD) |
Trailing
PE (x) |
Forward
PE (x) |
Price Sales
TTM (x) |
Price to Book Value (x)
|
Enterprise Value
to Revenue (x) |
Enterprise Value
to EBITDA (x) |
|---|---|---|---|---|---|---|---|---|
| HYPMY Hypera SA |
0.07 1.77% |
4.02 | 8.75 | 7.26 | 0.36 | 1.14 | 2.54 | 7.38 |
| MKKGY Merck KGaA ADR |
-0.22 0.66% |
33.17 | 21.25 | 14.93 | 3.10 | 2.14 | 3.60 | 12.98 |
| MKGAF MERCK Kommanditgesellschaft auf Aktien |
-2.76 1.62% |
167.12 | 24.86 | 15.11 | 3.13 | 1.98 | 3.08 | 18.89 |
| TAK Takeda Pharmaceutical Co Ltd ADR |
-0.17 0.80% |
21.02 | - | 10.96 | 0.01 | 1.20 | 2.94 | 23.11 |
| TKPHF Takeda Pharmaceutical Co. Ltd. |
- -% |
41.85 | - | 10.66 | 0.01 | 1.16 | 2.94 | 23.11 |
Hypera S.A. operates as a pharmaceutical company in Brazil. The company provides sweeteners products under the Adocyl, finn, and Zero-cal brands; analgesics and anti-inflammatories products under the Doril, Atroveran, Calminex, Alivium, Buscopan, Buscofem, geloll, Torsilax, Neosaldina, and naprohax brands; cold and flu remedies and decongestants products under BENEGRIO, Rinosoro, Blu, Neosoro, Coristina, APRACUR, and Fluviral brands. It offers antihistamines products under Alektos, Histamin, Polaramine, PredSim, and Desrinite brands; antiseptics products under Merthiolate brand; Herbal medicine products under Maracugina, Eparema, Tamarine, and Naturetti brands; gastrointestinal products under Dramin, Estomazil, Engov, Lacto-purga, gastrol, Epocler, Bifilax, and Pepsamar brands. In addition, the company provides generics products under neo quimica brand; skicare products under episol, epidrat, simple organic, and bioage brands; supplements and vitamins products Addera, Biotonico Fontoura, Colflex, and Vitasay brands; and other products under Nebacetin, Cepacol, ESCABIN, Mirrorelax, Ammy, Nesina, and Diprospan brands. The company was formerly known as Hypermarcas S.A. and changed its name to Hypera S.A. in February 2018. Hypera S.A. was founded in 1999 and is headquartered in São Paulo, Brazil.

Av. Magalhães de Castro, 4800, São Paulo, SP, Brazil, 05676-120

55 11 3627 4206

10564
| Name | Title | Year Born |
|---|---|---|
| Mr. Breno Toledo Pires de Oliveira | CEO & Director | NA |
| Mr. Adalmario Ghovatto Satheler do Couto | Investor Relations Officer & CFO | NA |
| Mr. Carlos Roberto Scorsi | Chief Operating officer | 1962 |
| Juliana Aguinaga Damião Salem | Sr. Legal Officer | NA |
| Joao Felipe Khamis Aguilar | Risks & Compliance Officer | NA |
| Mr. Luiz Eduardo Sales Clavis | VP of Sales & Marketing | NA |
| Mauricio Christovam | Sr. HR Officer | NA |
| Mr. Nelson José de Mello | Chief Corp. Relations Officer | 1959 |
| Mr. Hélio Segouras | Head of Consumer Health | NA |
| Mr. Martim Prado Mattos | Sec. | 1980 |
Disclaimer - (*)This information, including any data, is sourced from Unicorn Data Services SAS, trading as EOD Historical Data (“EODHD”) on an ‘as is’ basis, using their API. We cannot guarantee the completeness or validity of the information and data provided on this page, as well as via the API. In some cases, the data may include analyst ratings or recommendations sourced through the EODHD API, which are intended solely for general information purposes.
This information does not consider your personal objectives, financial situation, or needs. Kalkine is not liable for any errors or omissions in the information provided or for any actions taken in reliance on it. You should seek advice from a financial adviser, stockbroker or other professional adviser (including taxation and legal advice) as necessary before acting on this information.

Download a free report with stock ideas and industry insights for general information.
Download Free Report Now →


Basic Materials
 +0.64%
Communication Services
 -0.20%

Consumer Cyclical
-0.23%

Consumer Defensive
-0.30%

Energy
+0.23%

Financial Services
-0.34%
Financials
+0.39%

Healthcare
+0.70%

Industrials
+0.42%

Real Estate
-0.37%

Technology
+1.37%

Utilities
+0.19%
Note: Daily price change (%) by sector excluding stocks with +/-90% daily price change. Companies above $500 million market capitalization are considered.
 Portfolio
 Watchlist


 Please wait processing your request...