 CA
 NZ
 UK
 AU
 IND

 US


…
Desarrolladora Homex, S.A.B. de C.V. operates as an integrated housing company in Mexico. It also develops, constructs, and sells affordable housing, middle-income, and residential housing. The company was founded in 1989 and is based in Culiacán, Mexico.
Source: TradingView
The charts and visual representations are sourced from TradingView through embedded widgets. For any issues with chart display, please visit the TradingView website
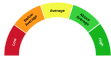
A unique technical analysis driven score developed by Kalkine showing momentum in stock prices based on select technical indicators identified.
Desarrolladora Homex SAB de CV is a Mexican homebuilder focused on low- and middle-income residential development, with shares traded OTC for international investors. Long-term growth may be supported by sustained housing demand, urbanization and government programs for affordable housing, and investors may value exposure to that segment if operational execution and balance-sheet stability improve.
Material risks include historical financial and operational volatility, limited disclosure and liquidity on the OTC market, and sensitivity to regulatory shifts, interest rates and cyclical housing demand.

Note: The summary and risk score provided above is created by AI and should not be construed as a recommendation of Kalkine.


| Breakdown | 2022-12-31 | 2021-12-31 | 2020-12-31 | 2019-12-31 | 2018-12-31 |
|---|---|---|---|---|---|
| Type | yearly | yearly | yearly | yearly | yearly |
| Date | 2022-12-31 | 2021-12-31 | 2020-12-31 | 2019-12-31 | 2018-12-31 |
| Income before tax | - | - | - | -432.07M | 1027.14M |
| Minority interest | - | - | -6.51M | -4.17M | -20.48M |
| Net income | - | - | - | 517.60M | 861.49M |
| Selling general administrative | - | - | - | 337.62M | 468.10M |
| Gross profit | - | - | - | 199.37M | 259.33M |
| Ebit | -55.19M | 292.18M | 425.90M | -400.74M | 883.64M |
| Operating income | - | - | - | -380.27M | -208.77M |
| Other operating expenses | 44.43M | 253.29M | 469.67M | 262.49M | 1069.29M |
| Interest expense | - | 0.00M | 0.00M | 0.00M | 0.00M |
| Income tax expense | - | 5.54M | 0.18M | -948.05M | 165.68M |
| Total revenue | - | - | - | 1181.80M | 1074.20M |
| Total operating expenses | - | - | - | 1562.08M | 1282.97M |
| Cost of revenue | - | - | - | 982.43M | 814.87M |
| Total other income expense net | - | - | - | -51.80M | 1235.91M |
| Discontinued operations | - | 911.54M | 911.54M | 911.54M | 911.54M |
| Net income from continuing ops | - | - | - | 515.98M | 861.47M |
| Net income applicable to common shares | -0.59M | 1158.81M | 413.65M | 517.70M | 861.49M |
| Breakdown | 2022-12-31 | 2021-12-31 | 2020-12-31 | 2019-12-31 | 2018-12-31 |
|---|---|---|---|---|---|
| Type | yearly | yearly | yearly | yearly | yearly |
| Date | 2022-12-31 | 2021-12-31 | 2020-12-31 | 2019-12-31 | 2018-12-31 |
| Total assets | - | - | - | 3756.26M | 4026.00M |
| Other current assets | 36.93M | 28.22M | 109.89M | 111.14M | 292.99M |
| Total liab | - | - | - | 5693.33M | 6478.96M |
| Total stockholder equity | - | - | - | -1932.91M | -2432.48M |
| Deferred long term liab | - | - | - | 0.21M | - |
| Other current liab | 644.35M | 278.18M | 264.37M | 1252.95M | 2111.82M |
| Common stock | 7180.49M | 7170.07M | 6703.41M | 6703.41M | 6703.41M |
| Retained earnings | -9235.67M | -9142.84M | -10301.65M | -10715.30M | -11214.96M |
| Other liab | 150.97M | 212.04M | 726.21M | 1.93M | 949.65M |
| Other assets | 344.01M | 355.03M | 270.88M | 272.94M | 542.02M |
| Cash | - | - | - | 22.64M | 100.22M |
| Total current liabilities | 897.76M | 752.96M | 3840.06M | 5399.17M | 4783.35M |
| Short term debt | - | - | - | 1249.75M | 803.02M |
| Short long term debt | - | - | - | 1249.75M | 803.02M |
| Other stockholder equity | 85.56M | 0.15M | 1.18M | 1.38M | -742.67M |
| Property plant equipment | 214.77M | 230.02M | 251.08M | 267.35M | 250.60M |
| Total current assets | 597.83M | 498.35M | 2551.11M | 3215.96M | 3233.37M |
| Net tangible assets | 107.98M | 104.98M | -1519.45M | -1932.90M | -2432.48M |
| Net receivables | 207.66M | 123.68M | 57.95M | 82.30M | 96.54M |
| Long term debt | - | - | - | 292.23M | 745.96M |
| Inventory | 314.12M | 318.49M | 2341.15M | 2999.89M | 2743.61M |
| Accounts payable | 93.23M | 143.51M | 1899.67M | 330.34M | 317.80M |
| Breakdown | 2022-12-31 | 2021-12-31 | 2020-12-31 | 2019-12-31 | 2018-12-31 |
|---|---|---|---|---|---|
| Type | yearly | yearly | yearly | yearly | yearly |
| Date | 2022-12-31 | 2021-12-31 | 2020-12-31 | 2019-12-31 | 2018-12-31 |
| Change to liabilities | 80.48M | -546.32M | 114.91M | 193.29M | -90.70M |
| Total cashflows from investing activities | -62.12M | -938.77M | -10.78M | 5.92M | 472.31M |
| Net borrowings | 64.60M | 37.61M | -35.60M | 82.33M | 157.48M |
| Total cash from financing activities | 52.75M | 457.31M | -96.12M | -10.96M | 228.51M |
| Change to operating activities | 30.17M | -180.82M | 42.01M | -14.66M | -258.45M |
| Net income | -0.59M | 1158.81M | 413.65M | 517.70M | 861.49M |
| Change in cash | 11.15M | -14.14M | 19.47M | -77.58M | 60.27M |
| Total cash from operating activities | 20.52M | 467.32M | 126.36M | -72.53M | -640.54M |
| Depreciation | 29.56M | 23.56M | 22.13M | 8.65M | 11.83M |
| Other cashflows from investing activities | -50.00M | -911.54M | 1.03M | -9.99M | -9.99M |
| Change to inventory | 14.15M | 154.14M | 88.28M | -376.82M | 1440.42M |
| Change to account receivables | -47.56M | -19.92M | -6.96M | 9.54M | -5.95M |
| Other cashflows from financing activities | -15.12M | -46.96M | -60.52M | -93.30M | -17.94M |
| Change to netincome | -7.92M | -141.81M | -607.97M | -410.24M | -2599.19M |
| Capital expenditures | 16.57M | 2.65M | 10.93M | 4.56M | 257.51M |
Sector: Consumer Cyclical Industry: Residential Construction
|
Stock Name
|
Change
(USD) |
Price
(USD) |
Trailing
PE (x) |
Forward
PE (x) |
Price Sales
TTM (x) |
Price to Book Value (x)
|
Enterprise Value
to Revenue (x) |
Enterprise Value
to EBITDA (x) |
|---|---|---|---|---|---|---|---|---|
| DHHXF Desarrolladora Homex SAB de CV |
- -% |
0.00 | 0.01 | - | 0.01 | 0.09 | 0.01 | 0.02 |
| DHI DR Horton Inc |
2.87 2.01% |
145.51 | 15.22 | 15.31 | 1.41 | 1.85 | 1.42 | 11.25 |
| LEN Lennar Corporation |
0.80 0.99% |
80.72 | 10.74 | 10.32 | 1.20 | 1.57 | 1.10 | 6.86 |
| PHM PulteGroup Inc |
2.18 1.78% |
124.70 | 8.37 | 9.75 | 1.29 | 2.22 | 1.33 | 6.07 |
| LEN-B Lennar Corporation |
1.03 1.33% |
78.61 | 12.33 | 12.06 | 0.58 | 0.88 | 0.71 | 10.61 |
Desarrolladora Homex, S.A.B. de C.V. operates as an integrated housing company in Mexico. It also develops, constructs, and sells affordable housing, middle-income, and residential housing. The company was founded in 1989 and is based in Culiacán, Mexico.

Boulevard Rotarismo No. 1140, Culiacán, SI, Mexico, 80020

52 1 667 758 5800

379
| Name | Title | Year Born |
|---|---|---|
| Mr. Jose Alberto Banos Lopez | Chief Exec. Officer | 1980 |
| Mr. Mario Israel Colín Miranda | CFO & Director of Admin. | 1982 |
| Ms. Vania Fueyo Zarain | Head of Investor Relations | 1981 |
| Mr. Rigel Ortiz Fernandez | Legal Director | 1980 |
| Mr. Carlos Hernandez Arroyo | Director of Human Devel. & Social Responsibility | 1974 |
| Mr. Jose Manuel Valadez Lobato | Co-Director General | 1975 |
| Mr. Rene Fernando Guerrero Chiquete | Co-General Director | 1981 |
| Mr. Miguel Angel Villegas Cuevas | Chief Financial Officer | 1985 |
| Mr. Mario Israel Colín Miranda | Director of Administration | 1982 |
| Ms. Carmen Leticia Gerardo Barraza | Legal Director | 1990 |
Disclaimer - (*)This information, including any data, is sourced from Unicorn Data Services SAS, trading as EOD Historical Data (“EODHD”) on an ‘as is’ basis, using their API. We cannot guarantee the completeness or validity of the information and data provided on this page, as well as via the API. In some cases, the data may include analyst ratings or recommendations sourced through the EODHD API, which are intended solely for general information purposes.
This information does not consider your personal objectives, financial situation, or needs. Kalkine is not liable for any errors or omissions in the information provided or for any actions taken in reliance on it. You should seek advice from a financial adviser, stockbroker or other professional adviser (including taxation and legal advice) as necessary before acting on this information.

Download a free report with stock ideas and industry insights for general information.
Download Free Report Now →


Basic Materials
 -2.93%
Communication Services
-1.00%

Consumer Cyclical
-1.11%

Consumer Defensive
-0.41%

Energy
-1.31%

Financial Services
-1.34%
Financials
-3.22%

Healthcare
-1.31%

Industrials
-1.82%

Real Estate
-0.47%

Technology
-3.76%

Utilities
-0.71%
Note: Daily price change (%) by sector excluding stocks with +/-90% daily price change. Companies above $500 million market capitalization are considered.
 Portfolio
 Watchlist


 +-%
 Please wait processing your request...