 CA
 NZ
 UK
 AU
 IND

 US


…
DEUTZ Aktiengesellschaft engages in the development, production, distribution, maintenance, and servicing of diesel and gas engines in Germany, Rest of Europe, the Middle East, Africa, the Asia Pacific, and the United States. It operates through five segments: Services, Engines, NewTech, Energy, and Defense & Other. The company offers engine finder, diesel engines, gas and gasoline engines, and hydrogen engines, as well as electric technology, such as electric systems, high voltage battery systems, and powertree products. It also provides spare parts for large and medium sized engines, such as turbo charger, starter, alternator, piston, piston liner, valves, crankshaft, camshaft, piston rods, water pump, oil pump, oil cooler, injection system, cylinder head, engine control unit, eat technology; operating liquids, oil, coolant, power blue, additives, fuel requirements; maintenance parts, air, oil, fuel filters, cylindrical head gasket, engine gasket set, and v- belt; xchange engines and parts; lifecycle solutions, care programs, diesel particulate filter cleaning services; daimler truck off-highway engines services; and hybrid, all-electric, and hydrogen drives, including mobile rapid charging stations and related services. In addition, the company offers compact engine systems and engine accessories. Its products are used in various applications, such as construction and agricultural machinery, mining, defense, material handling, energy supply, stationary systems, commercial vehicles, rail vehicles, ground support, and other applications. DEUTZ Aktiengesellschaft was founded in 1864 and is headquartered in Cologne, Germany.
Source: TradingView
The charts and visual representations are sourced from TradingView through embedded widgets. For any issues with chart display, please visit the TradingView website
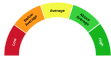
A unique technical analysis driven score developed by Kalkine showing momentum in stock prices based on select technical indicators identified.


| Breakdown | 2025-12-31 | 2024-12-31 | 2023-12-31 | 2022-12-31 | 2021-12-31 |
|---|---|---|---|---|---|
| Type | yearly | yearly | yearly | yearly | yearly |
| Date | 2025-12-31 | 2024-12-31 | 2023-12-31 | 2022-12-31 | 2021-12-31 |
| Income before tax | 54.68M | 24.70M | 108.20M | 75.80M | 29.10M |
| Minority interest | - | - | - | 0.00M | 0.00M |
| Net income | 53.58M | 51.80M | 81.90M | 80.20M | 38.20M |
| Selling general administrative | - | 41.90M | 22.20M | 69.00M | 61.60M |
| Selling and marketing expenses | - | 39.80M | 44.90M | 120.60M | 103.20M |
| Gross profit | 404.05M | 400.80M | 446.80M | 360.80M | 272.50M |
| Reconciled depreciation | - | 104.10M | 108.70M | 93.60M | 89.00M |
| Ebit | 51.68M | 45.60M | 124.60M | 87.90M | 37.20M |
| Ebitda | 147.24M | 149.70M | 233.30M | 181.50M | 126.20M |
| Depreciation and amortization | 95.56M | 104.10M | 108.70M | 93.60M | 89.00M |
| Operating income | 51.68M | 35.80M | 131.90M | 89.40M | 37.20M |
| Other operating expenses | 1991.35M | 1777.90M | 1931.30M | 1864.70M | 1588.00M |
| Interest expense | 20.19M | 21.64M | 16.40M | 7.20M | 5.20M |
| Tax provision | - | -17.30M | 1.30M | -4.40M | -9.10M |
| Interest income | - | 2.40M | 1.80M | 1.30M | 0.20M |
| Net interest income | - | -17.20M | -15.30M | -6.80M | -5.00M |
| Income tax expense | 0.60M | -17.30M | 1.30M | -4.40M | -9.10M |
| Total revenue | 2043.03M | 1813.70M | 2063.20M | 1953.40M | 1617.30M |
| Total operating expenses | 352.37M | 365.00M | 314.90M | 272.10M | 243.20M |
| Cost of revenue | 1638.99M | 1412.90M | 1616.40M | 1592.60M | 1344.80M |
| Total other income expense net | 3.00M | -11.10M | -23.70M | -13.60M | -8.10M |
| Net income from continuing ops | - | 42.00M | 106.90M | 80.20M | 38.20M |
| Net income applicable to common shares | - | - | - | 80.20M | 38.20M |
| Breakdown | 2025-12-31 | 2024-12-31 | 2023-12-31 | 2022-12-31 | 2021-12-31 |
|---|---|---|---|---|---|
| Type | yearly | yearly | yearly | yearly | yearly |
| Date | 2025-12-31 | 2024-12-31 | 2023-12-31 | 2022-12-31 | 2021-12-31 |
| Total assets | 1954.67M | 1683.30M | 1590.20M | 1475.40M | 1290.10M |
| Intangible assets | 229.21M | 221.30M | 121.90M | 113.80M | 127.50M |
| Other current assets | 1.10M | 36.30M | 98.50M | 1.70M | 0.70M |
| Total liab | 975.03M | 835.40M | 847.00M | 806.60M | 701.70M |
| Total stockholder equity | 976.23M | 847.90M | 743.20M | 668.80M | 588.40M |
| Deferred long term liab | - | - | - | 0.70M | 0.20M |
| Other current liab | 212.32M | 181.90M | 194.10M | 177.40M | 162.60M |
| Common stock | 390.65M | 354.70M | 322.50M | 309.00M | 309.00M |
| Capital stock | - | 354.70M | 322.50M | 309.00M | 309.00M |
| Retained earnings | 450.23M | 421.10M | 387.10M | 330.40M | 246.90M |
| Other liab | - | - | - | 118.60M | 165.50M |
| Good will | 245.21M | 81.70M | 38.00M | 55.50M | 54.30M |
| Other assets | - | - | -71.90M | 124.20M | 109.80M |
| Cash | 63.48M | 62.00M | 90.10M | 54.90M | 36.10M |
| Total current liabilities | 685.64M | 574.30M | 644.10M | 610.80M | 487.00M |
| Current deferred revenue | - | - | -6.40M | 97.70M | 99.70M |
| Net debt | 269.30M | 225.60M | 163.40M | 164.20M | 79.70M |
| Short term debt | 212.72M | 155.90M | 187.60M | 141.90M | 66.60M |
| Short long term debt | - | 129.10M | 171.70M | 124.10M | 50.70M |
| Short long term debt total | 332.78M | 287.60M | 253.50M | 219.10M | 115.80M |
| Other stockholder equity | 170.74M | 78.90M | 40.30M | 29.40M | 32.50M |
| Property plant equipment | - | - | - | 372.50M | 340.60M |
| Total current assets | 778.61M | 745.80M | 855.50M | 745.10M | 593.30M |
| Net tangible assets | - | - | - | 499.50M | 406.60M |
| Short term investments | - | - | 0.50M | - | - |
| Net receivables | 263.20M | 215.90M | 233.00M | 187.70M | 181.20M |
| Long term debt | - | 71.60M | 0.30M | 0.40M | 3.80M |
| Inventory | 450.83M | 431.60M | 433.90M | 451.60M | 375.30M |
| Accounts payable | 260.60M | 235.00M | 256.00M | 291.50M | 257.80M |
| Accumulated other comprehensive income | -35.39M | -6.80M | -6.70M | - | - |
| Non currrent assets other | - | 11.10M | 87.20M | 65.00M | 67.50M |
| Non current assets total | 1176.06M | 937.50M | 734.70M | 730.30M | 696.80M |
| Capital lease obligations | - | 86.90M | 81.50M | 94.60M | 61.30M |
| Breakdown | 2025-12-31 | 2024-12-31 | 2023-12-31 | 2022-12-31 | 2021-12-31 |
|---|---|---|---|---|---|
| Type | yearly | yearly | yearly | yearly | yearly |
| Date | 2025-12-31 | 2024-12-31 | 2023-12-31 | 2022-12-31 | 2021-12-31 |
| Investments | - | -171.90M | -97.90M | -67.20M | -5.80M |
| Change to liabilities | - | - | - | 31.20M | 111.30M |
| Total cashflows from investing activities | -244.61M | -171.90M | -97.90M | -67.20M | -67.20M |
| Net borrowings | - | 27.20M | 46.80M | 52.90M | -51.40M |
| Total cash from financing activities | 124.05M | 41.30M | -4.60M | 27.60M | -56.10M |
| Change to operating activities | - | - | - | -24.20M | -24.80M |
| Net income | - | 41.90M | 123.50M | 82.60M | 34.10M |
| Change in cash | 8.85M | -28.10M | 35.20M | 18.80M | -28.60M |
| Begin period cash flow | 54.63M | 90.10M | 54.90M | 36.10M | 64.70M |
| End period cash flow | 63.48M | 62.00M | 90.10M | 54.90M | 36.10M |
| Total cash from operating activities | 124.25M | 101.70M | 138.80M | 57.70M | 93.30M |
| Issuance of capital stock | - | 70.80M | 0.00M | - | - |
| Depreciation | 95.56M | 104.10M | 108.70M | 93.60M | 89.00M |
| Other cashflows from investing activities | -82.07M | 76.20M | -1.60M | 0.20M | 0.90M |
| Dividends paid | 23.59M | 21.40M | 18.90M | 18.20M | 18.20M |
| Change to inventory | -13.79M | 27.70M | -9.40M | -72.40M | -94.10M |
| Change to account receivables | -4.70M | 33.00M | -15.50M | -48.00M | -18.00M |
| Other cashflows from financing activities | -20.49M | -35.30M | -32.50M | 65.80M | -5.30M |
| Change to netincome | - | - | - | -3.30M | -11.90M |
| Capital expenditures | 82.07M | 64.20M | 65.00M | 58.20M | 61.70M |
| Change in working capital | 11.90M | -10.80M | -64.70M | -113.40M | -25.60M |
| Stock based compensation | - | - | 0.62M | - | - |
| Other non cash items | 16.79M | -33.50M | -28.70M | -5.10M | -4.20M |
| Free cash flow | 42.18M | 37.50M | 73.80M | -0.50M | 31.60M |
Sector: Industrials Industry: Specialty Industrial Machinery
|
Stock Name
|
Change
(USD) |
Price
(USD) |
Trailing
PE (x) |
Forward
PE (x) |
Price Sales
TTM (x) |
Price to Book Value (x)
|
Enterprise Value
to Revenue (x) |
Enterprise Value
to EBITDA (x) |
|---|---|---|---|---|---|---|---|---|
| DEUZF DEUTZ Aktiengesellschaft |
- -% |
11.29 | 23.61 | - | 1.02 | 1.91 | 1.11 | 11.64 |
| GEV GE Vernova LLC |
-57.28 7.57% |
699.00 | 56.16 | 67.57 | 7.02 | 23.82 | 6.79 | 115.11 |
| SMAWF Siemens AG Class N |
- -% |
287.12 | 25.72 | 20.16 | 2.87 | 2.96 | 2.85 | 13.79 |
| SBGSF Schneider Electric SE |
-6.50 2.58% |
245.50 | 32.06 | 22.47 | 4.40 | 6.27 | 4.00 | 19.13 |
| ETN Eaton Corporation PLC |
-19.12 5.78% |
311.45 | 39.21 | 30.77 | 5.80 | 8.18 | 6.15 | 27.30 |
DEUTZ Aktiengesellschaft engages in the development, production, distribution, maintenance, and servicing of diesel and gas engines in Germany, Rest of Europe, the Middle East, Africa, the Asia Pacific, and the United States. It operates through five segments: Services, Engines, NewTech, Energy, and Defense & Other. The company offers engine finder, diesel engines, gas and gasoline engines, and hydrogen engines, as well as electric technology, such as electric systems, high voltage battery systems, and powertree products. It also provides spare parts for large and medium sized engines, such as turbo charger, starter, alternator, piston, piston liner, valves, crankshaft, camshaft, piston rods, water pump, oil pump, oil cooler, injection system, cylinder head, engine control unit, eat technology; operating liquids, oil, coolant, power blue, additives, fuel requirements; maintenance parts, air, oil, fuel filters, cylindrical head gasket, engine gasket set, and v- belt; xchange engines and parts; lifecycle solutions, care programs, diesel particulate filter cleaning services; daimler truck off-highway engines services; and hybrid, all-electric, and hydrogen drives, including mobile rapid charging stations and related services. In addition, the company offers compact engine systems and engine accessories. Its products are used in various applications, such as construction and agricultural machinery, mining, defense, material handling, energy supply, stationary systems, commercial vehicles, rail vehicles, ground support, and other applications. DEUTZ Aktiengesellschaft was founded in 1864 and is headquartered in Cologne, Germany.
| Name | Title | Year Born |
|---|---|---|
| Dr. Sebastian C. Schulte | Chairman of Management Board, Interim CFO & Labor Director | 1978 |
| Dr. Markus Muller | CTO, CSO & Member of Management Board | 1980 |
| Dr. Petra Mayer | COO & Member of the Management Board | NA |
| Timo Krutoff | Member of Board of Management | 1978 |
| Christian Ludwig | SVP of Communications & Investor Relations | NA |
| Dr. Herbert Vossel | Head of Legal & Patents | NA |
| Mr. Alexander Stadtler | Head of Asia Region | NA |
| Mr. Christian Krupp | Head of Fin. & Controlling | NA |
| Dr. Markus Schwaderlapp | Head of R&D | NA |
| Dr. Christoph Ballin | Head of Strategy | NA |
Disclaimer - (*)This information, including any data, is sourced from Unicorn Data Services SAS, trading as EOD Historical Data (“EODHD”) on an ‘as is’ basis, using their API. We cannot guarantee the completeness or validity of the information and data provided on this page, as well as via the API. In some cases, the data may include analyst ratings or recommendations sourced through the EODHD API, which are intended solely for general information purposes.
This information does not consider your personal objectives, financial situation, or needs. Kalkine is not liable for any errors or omissions in the information provided or for any actions taken in reliance on it. You should seek advice from a financial adviser, stockbroker or other professional adviser (including taxation and legal advice) as necessary before acting on this information.

Download a free report with stock ideas and industry insights for general information.
Download Free Report Now →


Basic Materials
 -2.93%
Communication Services
-1.00%

Consumer Cyclical
-1.11%

Consumer Defensive
-0.41%

Energy
-1.31%

Financial Services
-1.34%
Financials
-3.22%

Healthcare
-1.31%

Industrials
-1.82%

Real Estate
-0.47%

Technology
-3.76%

Utilities
-0.71%
Note: Daily price change (%) by sector excluding stocks with +/-90% daily price change. Companies above $500 million market capitalization are considered.
 Portfolio
 Watchlist


 +-%
 Please wait processing your request...