 CA
 NZ
 UK
 AU
 IND

 US


…
D&L Industries, Inc. provides products for food ingredients, oleochemicals for personal and home care use, raw materials for plastic products, and aerosol products in the Philippines, Asia, Europe, Oceania, Africa, and the United States. It operates through Food Ingredients; Colorants and Plastics Additives; Oleochemicals, Resins and Powder Coatings; and Consumer Products Original Design Manufacturer (ODM) segments. The Food Ingredients segment offers a line of industrial fats and oils, food ingredients, specialty fats and oils, and culinary and other specialty food ingredients to food manufacturers and quick-service restaurant chains; and food safety solutions, such as cleaning and sanitation agents. Its Colorants and Plastic Additives segment provides line of pigment blends, color and additive master batches, and engineered polymers, which add properties, such as precise coloring, reduced friction, increased resistance, and plastics degradation for use in consumer goods, appliances, and outdoor furniture. The Oleochemicals, Resins and Powder Coatings segment offers coconut methyl ester/coco-biodiesel, other oleochemicals, and chemicals derived from vegetable oils; resins, such as polystyrene, acrylic emulsions, and polyester; and a line of powder coatings. Its Consumer Products ODM segment provides aerosol cans and components, insect control, industrial maintenance chemicals, home and personal care, and other products; and contract aerosol filling and compounding services. D&L Industries, Inc. was founded in 1963 and is headquartered in Quezon City, the Philippines. D&L Industries, Inc. is a subsidiary of Jadel Holdings Co., Inc.
Source: TradingView
The charts and visual representations are sourced from TradingView through embedded widgets. For any issues with chart display, please visit the TradingView website
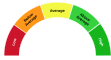
A unique technical analysis driven score developed by Kalkine showing momentum in stock prices based on select technical indicators identified.
Public disclosures for D&L Industries Inc (DALQF) are limited, making its exact core business and financial profile unclear. Small OTC industrial firms may benefit from cost control, niche product demand, and steady customer relationships, which could support growth if the company possesses those attributes and improves transparency; investors may find potential upside from better reporting and execution.

Note: The summary and risk score provided above is created by AI and should not be construed as a recommendation of Kalkine.


| Breakdown | 2025-12-31 | 2024-12-31 | 2023-12-31 | 2022-12-31 | 2021-12-31 |
|---|---|---|---|---|---|
| Type | yearly | yearly | yearly | yearly | yearly |
| Date | 2025-12-31 | 2024-12-31 | 2023-12-31 | 2022-12-31 | 2021-12-31 |
| Income before tax | 2949.60M | 2766.23M | 3020.27M | 4094.97M | 3219.84M |
| Minority interest | 0.00M | 0.00M | 0.00M | 0.00M | 0.00M |
| Net income | 2589.58M | 2342.14M | 2295.41M | 3317.52M | 2642.70M |
| Selling general administrative | 441.69M | 437.15M | 355.06M | 235.01M | 165.52M |
| Selling and marketing expenses | 1421.06M | 1290.56M | 839.91M | 930.76M | 662.20M |
| Gross profit | 7205.38M | 6254.94M | 5695.94M | 6066.06M | 4564.72M |
| Reconciled depreciation | 1543.52M | 1252.58M | 1020.27M | 806.81M | 707.44M |
| Ebit | 4308.62M | 3736.90M | 3633.60M | 4319.57M | 3338.66M |
| Ebitda | 5852.15M | 4989.48M | 4455.40M | 5126.37M | 4046.10M |
| Depreciation and amortization | 1543.53M | 1252.58M | 821.80M | 806.81M | 707.44M |
| Operating income | 4331.49M | 3736.90M | 3633.60M | 4331.11M | 3361.48M |
| Other operating expenses | 51056.65M | 36937.91M | 29868.68M | 39331.79M | 27566.69M |
| Interest expense | 1359.03M | 970.67M | 689.32M | 236.14M | 141.63M |
| Tax provision | 360.01M | 424.09M | 804.51M | 777.45M | 577.15M |
| Interest income | 3.28M | 9.98M | 15.60M | 3.83M | 5.39M |
| Net interest income | -1382.16M | -977.21M | -519.59M | -273.60M | -164.70M |
| Income tax expense | 360.01M | 424.09M | 724.86M | 777.45M | 577.15M |
| Total revenue | 55388.14M | 40674.81M | 33502.28M | 43484.55M | 30855.26M |
| Total operating expenses | 2873.89M | 2518.04M | 2062.34M | 1913.30M | 1276.15M |
| Cost of revenue | 48182.75M | 34419.87M | 27806.34M | 37418.48M | 26290.54M |
| Total other income expense net | -1381.89M | -970.67M | -613.33M | -236.14M | -141.63M |
| Net income from continuing ops | 2589.58M | 2342.14M | 2569.30M | 3317.52M | 2642.70M |
| Net income applicable to common shares | - | - | - | 3317.52M | 2642.70M |
| Breakdown | 2025-12-31 | 2024-12-31 | 2023-12-31 | 2022-12-31 | 2021-12-31 |
|---|---|---|---|---|---|
| Type | yearly | yearly | yearly | yearly | yearly |
| Date | 2025-12-31 | 2024-12-31 | 2023-12-31 | 2022-12-31 | 2021-12-31 |
| Total assets | 53012.27M | 48369.40M | 42625.15M | 40760.40M | 36325.82M |
| Intangible assets | - | - | - | 64.80M | - |
| Other current assets | 7783.72M | 5933.35M | 4869.70M | 32.15M | 96.05M |
| Total liab | 30143.07M | 26579.78M | 21757.62M | 20109.18M | 17220.88M |
| Total stockholder equity | 22869.20M | 21789.62M | 20867.53M | 20651.22M | 19104.94M |
| Other current liab | 812.70M | 853.73M | 1036.61M | 807.86M | 438.72M |
| Common stock | 7142.86M | 7142.86M | 7142.86M | 7142.86M | 7142.86M |
| Capital stock | 7142.86M | 7142.86M | 7142.86M | 7142.86M | 7142.86M |
| Retained earnings | 12133.46M | 11065.31M | 10216.02M | 10063.47M | 8460.23M |
| Other liab | - | - | - | 169.64M | 46.49M |
| Good will | 3367.85M | 3367.85M | 3367.85M | 3367.85M | 3367.85M |
| Other assets | - | - | -31.58M | 2682.31M | 2159.76M |
| Cash | 3394.16M | 2837.93M | 2844.17M | 3250.17M | 5223.08M |
| Total current liabilities | 28150.34M | 22656.01M | 18080.39M | 14632.62M | 11997.43M |
| Current deferred revenue | - | - | 0.06M | 806.47M | 437.89M |
| Net debt | 23042.67M | 19074.16M | 14846.10M | 13050.31M | 8967.63M |
| Short term debt | 24657.74M | 18135.14M | 14141.18M | 10993.55M | 9013.76M |
| Short long term debt | 24080.81M | 17850.00M | 13890.81M | 10520.00M | 8850.00M |
| Short long term debt total | 26436.83M | 21912.09M | 17690.28M | 16300.48M | 14190.72M |
| Other stockholder equity | 3592.88M | 3255.17M | 3508.65M | 3444.90M | 3501.85M |
| Property plant equipment | - | - | - | 12437.06M | 8814.13M |
| Total current assets | 32795.06M | 28395.62M | 22582.60M | 22036.42M | 21786.08M |
| Net tangible assets | - | - | - | 17283.38M | 15737.09M |
| Short term investments | 41.80M | 39.96M | 34.15M | 82.71M | 650.48M |
| Net receivables | 9113.12M | 8212.58M | 5778.08M | 9925.96M | 8490.95M |
| Long term debt | 1215.00M | 3240.27M | 3244.68M | 4957.82M | 4940.01M |
| Inventory | 12462.25M | 11371.81M | 9056.49M | 8745.44M | 7325.51M |
| Accounts payable | 2676.89M | 3661.19M | 2800.70M | 2831.21M | 2544.95M |
| Accumulated other comprehensive income | - | 326.29M | 753.48M | - | - |
| Non currrent assets other | 2538.49M | 2452.86M | 3255.33M | 2610.77M | 2754.27M |
| Non current assets total | 20217.22M | 19973.78M | 20042.55M | 18723.98M | 14539.74M |
| Capital lease obligations | 1141.02M | 821.82M | 554.79M | 822.65M | 400.71M |
| Breakdown | 2025-12-31 | 2024-12-31 | 2023-12-31 | 2022-12-31 | 2021-12-31 |
|---|---|---|---|---|---|
| Type | yearly | yearly | yearly | yearly | yearly |
| Date | 2025-12-31 | 2024-12-31 | 2023-12-31 | 2022-12-31 | 2021-12-31 |
| Investments | 0.00M | -1083.20M | -2296.10M | -3134.95M | -3592.98M |
| Change to liabilities | - | - | - | 368.00M | 965.55M |
| Total cashflows from investing activities | -846.96M | -1083.20M | -1432.14M | -3134.95M | -3592.98M |
| Net borrowings | 4200.00M | 3950.00M | 1680.00M | 1270.57M | 8042.92M |
| Total cash from financing activities | 829.23M | 1046.80M | -1626.61M | -782.23M | 6466.52M |
| Change to operating activities | - | - | - | -1312.40M | -1393.20M |
| Net income | 2949.60M | 2766.23M | 3020.27M | 4094.97M | 3219.84M |
| Change in cash | 556.23M | -6.24M | -405.99M | -1972.92M | 3086.47M |
| Begin period cash flow | 2837.93M | 2844.17M | 3250.17M | 5223.08M | 2136.61M |
| End period cash flow | 3394.16M | 2837.93M | 2844.17M | 3250.17M | 5223.08M |
| Total cash from operating activities | 567.84M | 47.52M | 1895.82M | 1983.79M | 204.45M |
| Depreciation | 1543.52M | 1252.58M | 821.80M | 806.81M | 707.44M |
| Other cashflows from investing activities | 2.28M | 14.96M | 29.00M | 0.13M | 0.06M |
| Dividends paid | 1521.43M | 1492.86M | 2142.86M | 1714.29M | 1364.29M |
| Change to inventory | -1164.89M | -2321.37M | -316.24M | -1432.11M | -1482.47M |
| Change to account receivables | -936.19M | -2433.93M | 30.46M | -334.57M | -1640.87M |
| Other cashflows from financing activities | -1849.34M | -1410.34M | 330.19M | 8932.06M | 9130.81M |
| Change to netincome | - | - | - | 570.55M | 405.31M |
| Capital expenditures | 849.23M | 1089.79M | 1511.20M | 3707.41M | 3593.16M |
| Change in working capital | -5142.54M | -4461.57M | -1095.59M | -2711.09M | -3551.00M |
| Other non cash items | 1217.27M | 490.29M | -850.67M | -206.90M | -171.84M |
| Free cash flow | -281.39M | -1042.27M | 1142.95M | -1723.63M | -3388.70M |
Sector: Basic Materials Industry: Specialty Chemicals
|
Stock Name
|
Change
(USD) |
Price
(USD) |
Trailing
PE (x) |
Forward
PE (x) |
Price Sales
TTM (x) |
Price to Book Value (x)
|
Enterprise Value
to Revenue (x) |
Enterprise Value
to EBITDA (x) |
|---|---|---|---|---|---|---|---|---|
| DALQF D&L Industries Inc |
- -% |
0.06 | 5.81 | 8.90 | 0.01 | 1.15 | 0.83 | 7.43 |
| LIN Linde plc Ordinary Shares |
-0.49 0.10% |
508.16 | 33.77 | 28.90 | 6.56 | 5.42 | 7.03 | 18.92 |
| AIQUY Air Liquide SA ADR |
-0.04 0.10% |
38.86 | 30.69 | 24.81 | 4.70 | 4.10 | 4.36 | 15.61 |
| AIQUF L'Air Liquide S.A |
- -% |
193.33 | 29.78 | 22.68 | 4.54 | 3.98 | 4.50 | 15.90 |
| SHW Sherwin-Williams Co |
-5.21 1.60% |
320.80 | 33.33 | 27.40 | 3.38 | 20.60 | 3.88 | 21.36 |
D&L Industries, Inc. provides products for food ingredients, oleochemicals for personal and home care use, raw materials for plastic products, and aerosol products in the Philippines, Asia, Europe, Oceania, Africa, and the United States. It operates through Food Ingredients; Colorants and Plastics Additives; Oleochemicals, Resins and Powder Coatings; and Consumer Products Original Design Manufacturer (ODM) segments. The Food Ingredients segment offers a line of industrial fats and oils, food ingredients, specialty fats and oils, and culinary and other specialty food ingredients to food manufacturers and quick-service restaurant chains; and food safety solutions, such as cleaning and sanitation agents. Its Colorants and Plastic Additives segment provides line of pigment blends, color and additive master batches, and engineered polymers, which add properties, such as precise coloring, reduced friction, increased resistance, and plastics degradation for use in consumer goods, appliances, and outdoor furniture. The Oleochemicals, Resins and Powder Coatings segment offers coconut methyl ester/coco-biodiesel, other oleochemicals, and chemicals derived from vegetable oils; resins, such as polystyrene, acrylic emulsions, and polyester; and a line of powder coatings. Its Consumer Products ODM segment provides aerosol cans and components, insect control, industrial maintenance chemicals, home and personal care, and other products; and contract aerosol filling and compounding services. D&L Industries, Inc. was founded in 1963 and is headquartered in Quezon City, the Philippines. D&L Industries, Inc. is a subsidiary of Jadel Holdings Co., Inc.
| Name | Title | Year Born |
|---|---|---|
| Mr. Alvin Dim Lao | CEO, Pres & Director | 1972 |
| Mr. Dean Ang Lao Jr. | Managing Director of Chemrez Technologies | 1967 |
| Mr. Vincent D. Lao | Managing Director of Oleo-Fats Inc | 1973 |
| Mr. Lester A. Lao | Managing Director of FIC & DLPC | 1969 |
| Mr. Franco Diego Q. Lao | CFO, Treasurer & Compliance Officer | 1979 |
| Mr. Joselito P. Rivera | Chief Operating Officer | 1962 |
| Attorney Kristine Ann C. Catindig-Ong | Corp. Information Officer, Corp. Legal Counsel & Corp. Sec. | 1981 |
| Ms. Crissa Marie U. Bondad | Investor Relations Officer | NA |
| Marife M. Maddawin | Controller | NA |
| Ms. Anne T. Lao | Assistant Corp. Sec. | 1991 |
Disclaimer - (*)This information, including any data, is sourced from Unicorn Data Services SAS, trading as EOD Historical Data (“EODHD”) on an ‘as is’ basis, using their API. We cannot guarantee the completeness or validity of the information and data provided on this page, as well as via the API. In some cases, the data may include analyst ratings or recommendations sourced through the EODHD API, which are intended solely for general information purposes.
This information does not consider your personal objectives, financial situation, or needs. Kalkine is not liable for any errors or omissions in the information provided or for any actions taken in reliance on it. You should seek advice from a financial adviser, stockbroker or other professional adviser (including taxation and legal advice) as necessary before acting on this information.

Download a free report with stock ideas and industry insights for general information.
Download Free Report Now →


Basic Materials
 +0.02%
Communication Services
 -0.63%

Consumer Cyclical
-0.11%

Consumer Defensive
-0.45%

Energy
+0.39%

Financial Services
-0.10%
Financials
-0.81%

Healthcare
+1.03%

Industrials
+0.32%

Real Estate
-0.31%

Technology
+0.59%

Utilities
-0.18%
Note: Daily price change (%) by sector excluding stocks with +/-90% daily price change. Companies above $500 million market capitalization are considered.
 Portfolio
 Watchlist


 Please wait processing your request...