 CA
 NZ
 UK
 AU
 IND

 US


…
Charles & Colvard, Ltd. operates as a fine jewelry company in the United States and internationally. It operates through two segments: Online Channels and Traditional. The company manufactures, markets, and distributes moissanite jewels and finished moissanite jewelry under the Charles & Colvard Created Moissanite brand; and premium moissanite gemstones under the Forever One brand name. It also markets and distributes lab grown diamonds and finished jewelry with lab grown diamonds under the Caydia brand. It sells its products at wholesale prices to distributors, manufacturers, retailers, and designers; and to end-consumers at retail prices through charlesandcolvard.com and moissaniteoutlet.com, third-party online marketplaces, drop-ship, and other e-commerce outlets, as well as through Charles & Colvard Signature Showroom and charlesandcolvarddirect.com for wholesale and retail customers. Charles & Colvard, Ltd. was incorporated in 1995 and is headquartered in Morrisville, North Carolina. On March 2, 2026, Charles & Colvard, Ltd. filed a voluntary petition for reorganization under Chapter 11 in the U.S. Bankruptcy Court for the Eastern District of North Carolina.
Source: TradingView
The charts and visual representations are sourced from TradingView through embedded widgets. For any issues with chart display, please visit the TradingView website
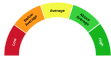
A unique technical analysis driven score developed by Kalkine showing momentum in stock prices based on select technical indicators identified.


| Breakdown | 2025-06-30 | 2023-06-30 | 2022-06-30 | 2021-06-30 | 2020-06-30 |
|---|---|---|---|---|---|
| Type | yearly | yearly | yearly | yearly | yearly |
| Date | 2025-06-30 | 2023-06-30 | 2022-06-30 | 2021-06-30 | 2020-06-30 |
| Income before tax | -14.36M | -13.68M | 2.89M | 6.48M | -6.16M |
| Net income | -14.36M | -19.58M | 2.37M | 12.81M | -6.16M |
| Selling general administrative | 5.78M | 5.02M | 4.95M | 4.44M | 4.86M |
| Selling and marketing expenses | 12.55M | 13.69M | 12.42M | 8.48M | 9.44M |
| Gross profit | 5.19M | 4.73M | 20.24M | 18.43M | 7.99M |
| Ebit | -14.42M | -13.68M | 2.87M | 6.49M | -6.16M |
| Ebitda | -13.72M | -13.03M | 3.35M | 7.05M | -5.67M |
| Depreciation and amortization | 0.70M | 0.65M | 0.48M | 0.57M | 0.49M |
| Operating income | -14.61M | -13.98M | 2.87M | 5.51M | -6.32M |
| Other operating expenses | 36.56M | 43.92M | 40.22M | 33.73M | 35.50M |
| Interest expense | 0.06M | - | - | 0.01M | 0.00M |
| Income tax expense | - | 5.90M | 0.52M | -6.33M | 0.00M |
| Total revenue | 21.96M | 29.95M | 43.09M | 39.24M | 29.19M |
| Total operating expenses | 19.80M | 18.71M | 17.37M | 12.92M | 14.30M |
| Cost of revenue | 16.76M | 25.21M | 22.85M | 20.81M | 21.20M |
| Total other income expense net | 0.24M | 0.30M | 0.02M | 0.97M | 0.16M |
| Breakdown | 2025-06-30 | 2023-06-30 | 2022-06-30 | 2021-06-30 | 2020-06-30 |
|---|---|---|---|---|---|
| Type | yearly | yearly | yearly | yearly | yearly |
| Date | 2025-06-30 | 2023-06-30 | 2022-06-30 | 2021-06-30 | 2020-06-30 |
| Total assets | 40.98M | 48.88M | 69.21M | 64.92M | 48.90M |
| Intangible assets | 0.37M | 0.31M | 0.27M | 0.21M | 0.17M |
| Other current assets | 6.08M | 6.02M | 6.70M | 1.10M | 1.80M |
| Total liab | 15.33M | 9.11M | 9.65M | 9.23M | 7.47M |
| Total stockholder equity | 25.65M | 39.77M | 59.56M | 55.69M | 41.44M |
| Other current liab | 2.96M | 0.63M | 0.75M | 0.93M | 0.21M |
| Common stock | 67.23M | 57.24M | 57.24M | 56.06M | 54.34M |
| Retained earnings | -57.55M | -43.18M | -23.60M | -25.98M | -38.79M |
| Cash | 4.14M | 10.45M | 15.67M | 21.30M | 13.99M |
| Total current liabilities | 14.13M | 7.06M | 6.80M | 5.62M | 6.49M |
| Current deferred revenue | 0.30M | 0.57M | 0.45M | 0.77M | 0.79M |
| Net debt | 0.27M | -7.52M | -11.96M | -17.14M | -11.58M |
| Short term debt | 3.20M | 0.88M | 0.86M | 0.57M | 1.44M |
| Short long term debt total | 4.41M | 2.93M | 3.70M | 4.17M | 2.41M |
| Other stockholder equity | 15.96M | 25.72M | 25.92M | 25.61M | 25.88M |
| Total current assets | 18.82M | 24.58M | 35.86M | 35.76M | 23.91M |
| Net receivables | 1.09M | 0.63M | 2.47M | 1.91M | 0.67M |
| Inventory | 7.51M | 7.48M | 11.02M | 11.45M | 7.44M |
| Accounts payable | 8.27M | 4.79M | 4.40M | 2.77M | 3.75M |
| Non currrent assets other | 17.47M | 19.33M | 22.54M | 17.77M | 23.24M |
| Non current assets total | 22.16M | 24.31M | 33.34M | 29.16M | 25.00M |
| Breakdown | 2025-06-30 | 2023-06-30 | 2022-06-30 | 2021-06-30 | 2020-06-30 |
|---|---|---|---|---|---|
| Type | yearly | yearly | yearly | yearly | yearly |
| Date | 2025-06-30 | 2023-06-30 | 2022-06-30 | 2021-06-30 | 2020-06-30 |
| Total cashflows from investing activities | -1.04M | -1.28M | -1.56M | -0.73M | -0.54M |
| Total cash from financing activities | 2.30M | -0.45M | 0.72M | 1.09M | 1.90M |
| Net income | -14.36M | -19.58M | 2.37M | 12.81M | -6.16M |
| Change in cash | -6.10M | -5.61M | -0.27M | 6.83M | 1.61M |
| Begin period cash flow | 15.57M | 21.18M | 21.45M | 14.62M | 13.01M |
| End period cash flow | 9.47M | 15.57M | 21.18M | 21.45M | 14.62M |
| Total cash from operating activities | -7.37M | -3.88M | 0.57M | 6.47M | 0.25M |
| Depreciation | 0.70M | 0.65M | 0.48M | 0.57M | 0.49M |
| Other cashflows from investing activities | -0.08M | -0.05M | - | -0.25M | - |
| Change to inventory | 1.32M | 0.76M | -4.54M | 1.31M | -2.76M |
| Change to account receivables | 0.01M | 1.77M | -0.48M | -0.96M | 1.32M |
| Sale purchase of stock | - | -0.45M | -0.04M | - | - |
| Other cashflows from financing activities | - | - | 0.76M | - | - |
| Capital expenditures | 0.95M | 1.28M | 1.56M | 0.48M | 0.54M |
| Change in working capital | 4.85M | 2.88M | -3.67M | -0.05M | -0.37M |
| Stock based compensation | 0.24M | 0.25M | 0.77M | 0.35M | 0.46M |
| Other non cash items | 1.21M | 6.07M | 0.12M | -0.86M | 5.83M |
| Free cash flow | -8.32M | -5.16M | -0.99M | 5.99M | -0.29M |
Sector: Consumer Cyclical Industry: Luxury Goods
|
Stock Name
|
Change
(USD) |
Price
(USD) |
Trailing
PE (x) |
Forward
PE (x) |
Price Sales
TTM (x) |
Price to Book Value (x)
|
Enterprise Value
to Revenue (x) |
|---|---|---|---|---|---|---|---|
| CTHRQ Charles & Colvard, Ltd. |
- -% |
0.01 | - | - | - | - | 0.01 |
| LVMHF LVMH Moët Hennessy - Louis Vuitton Société Européenne |
2.70 0.63% |
428.63 | 19.05 | 16.45 | 2.91 | 3.02 | 2.90 |
| LVMUY LVMH Moet Hennessy Louis Vuitton SA ADR |
0.43 0.51% |
85.57 | 18.92 | 16.37 | 2.90 | 3.01 | 2.90 |
| HESAY Hermes International SA |
-1.79 1.28% |
138.48 | 31.86 | 27.32 | 10.32 | 7.55 | 8.31 |
| HESAF Hermes International SCA |
56.45 4.20% |
1400.00 | 33.11 | 28.33 | 10.24 | 7.84 | 8.56 |
Charles & Colvard, Ltd. operates as a fine jewelry company in the United States and internationally. It operates through two segments: Online Channels and Traditional. The company manufactures, markets, and distributes moissanite jewels and finished moissanite jewelry under the Charles & Colvard Created Moissanite brand; and premium moissanite gemstones under the Forever One brand name. It also markets and distributes lab grown diamonds and finished jewelry with lab grown diamonds under the Caydia brand. It sells its products at wholesale prices to distributors, manufacturers, retailers, and designers; and to end-consumers at retail prices through charlesandcolvard.com and moissaniteoutlet.com, third-party online marketplaces, drop-ship, and other e-commerce outlets, as well as through Charles & Colvard Signature Showroom and charlesandcolvarddirect.com for wholesale and retail customers. Charles & Colvard, Ltd. was incorporated in 1995 and is headquartered in Morrisville, North Carolina. On March 2, 2026, Charles & Colvard, Ltd. filed a voluntary petition for reorganization under Chapter 11 in the U.S. Bankruptcy Court for the Eastern District of North Carolina.

170 Southport Drive, Morrisville, NC, United States, 27560

919 468 0399

24
| Name | Title | Year Born |
|---|---|---|
| Mr. Clint J. Pete CPA | CFO & Treasurer | 1962 |
| Mr. Michael R. Levin | Executive Chairman | 1963 |
Disclaimer - (*)This information, including any data, is sourced from Unicorn Data Services SAS, trading as EOD Historical Data (“EODHD”) on an ‘as is’ basis, using their API. We cannot guarantee the completeness or validity of the information and data provided on this page, as well as via the API. In some cases, the data may include analyst ratings or recommendations sourced through the EODHD API, which are intended solely for general information purposes.
This information does not consider your personal objectives, financial situation, or needs. Kalkine is not liable for any errors or omissions in the information provided or for any actions taken in reliance on it. You should seek advice from a financial adviser, stockbroker or other professional adviser (including taxation and legal advice) as necessary before acting on this information.

Download a free report with stock ideas and industry insights for general information.
Download Free Report Now →


Basic Materials
 -1.14%
Communication Services
-1.25%

Consumer Cyclical
-1.10%

Consumer Defensive
-0.88%

Energy
-0.75%

Financial Services
-0.95%
Financials
-0.37%

Healthcare
-0.71%

Industrials
-0.76%

Real Estate
-0.66%

Technology
-1.57%

Utilities
-0.40%
Note: Daily price change (%) by sector excluding stocks with +/-90% daily price change. Companies above $500 million market capitalization are considered.
 Portfolio
 Watchlist


 +-%
 Please wait processing your request...