 CA
 NZ
 UK
 AU
 IND

 US


…
CareView Communications, Inc. provides video monitoring solutions in the United States. The company offers CareView Patient Safety System, a video monitoring tool to enhance the practice of nursing, create a better work environment, and make the patient's hospital stay more satisfying, which is used in hospitals, nursing homes, adult living centers, and outpatient care facilities; and CareView Connect, a platform consisting of several products and applications targeted at enhancing the level of care and efficiency; an array of wearable and stationary buttons that allow a resident to summon help either for an emergency or assistance; a mobile app capable of delivering an alert to the caregiver and allows them document information around that alert; and alert management and monitoring system that provides a suite of hardware and software to facilitate a data-driven solution for alert management and monitoring. It also provides Caregiver Platform that offers caregiver connect mobile application to provide an interface to capture critical workflows, such as acknowledging and documenting alert presses by the resident. In addition, the company offers SitterView and TeleMedView that allow hospital staff to use CareView's video cameras to observe and communicate with patients remotely. CareView Communications, Inc. is based in Lewisville, Texas.
Source: TradingView
The charts and visual representations are sourced from TradingView through embedded widgets. For any issues with chart display, please visit the TradingView website
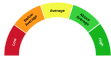
A unique technical analysis driven score developed by Kalkine showing momentum in stock prices based on select technical indicators identified.
Publicly available information on Careview Comm Inc (CRVW.US) is limited and the company's core business activities, product lines, and industry positioning are not clearly disclosed in accessible filings or press releases. Major long-term growth drivers are not documented, so any potential attractiveness to investors would depend on future verified disclosures that clarify revenue streams, market opportunity, or scalable operations.

Note: The summary and risk score provided above is created by AI and should not be construed as a recommendation of Kalkine.


| Breakdown | 2025-12-31 | 2024-12-31 | 2023-12-31 | 2022-12-31 | 2021-12-31 |
|---|---|---|---|---|---|
| Type | yearly | yearly | yearly | yearly | yearly |
| Date | 2025-12-31 | 2024-12-31 | 2023-12-31 | 2022-12-31 | 2021-12-31 |
| Income before tax | -3.19M | -4.73M | -3.88M | -6.04M | -10.08M |
| Net income | -3.20M | -4.70M | -3.95M | -6.04M | -10.08M |
| Selling general administrative | 3.32M | 3.89M | 4.27M | 4.13M | 3.78M |
| Gross profit | 5.84M | 4.91M | 6.53M | 5.08M | 5.02M |
| Reconciled depreciation | 0.14M | 0.23M | 0.41M | 0.55M | 0.64M |
| Ebit | - | - | - | - | -1.15M |
| Ebitda | - | - | - | 0.81M | -0.45M |
| Operating income | -0.06M | -1.58M | -0.69M | -1.27M | -1.15M |
| Interest expense | 3.21M | 3.21M | 3.21M | 6.26M | 8.95M |
| Tax provision | 0.01M | -0.03M | 0.07M | 0.00M | 0.00M |
| Interest income | 0.07M | 0.05M | 0.02M | 0.00M | 0.00M |
| Net interest income | -3.14M | -3.15M | -3.19M | -6.26M | -8.95M |
| Total revenue | 9.02M | 8.25M | 9.68M | 7.90M | 7.80M |
| Total operating expenses | 9.07M | 9.83M | 10.37M | 9.17M | 8.95M |
| Cost of revenue | 3.17M | 3.34M | 3.15M | 2.82M | 2.78M |
| Total other income expense net | - | - | - | 1.49M | 0.02M |
| Net income from continuing ops | -3.20M | -4.70M | -3.95M | -6.04M | -10.08M |
| Net income applicable to common shares | - | - | - | - | -10.08M |
| Breakdown | 2025-12-31 | 2024-12-31 | 2023-12-31 | 2022-12-31 | 2021-12-31 |
|---|---|---|---|---|---|
| Type | yearly | yearly | yearly | yearly | yearly |
| Date | 2025-12-31 | 2024-12-31 | 2023-12-31 | 2022-12-31 | 2021-12-31 |
| Total assets | 4.64M | 3.62M | 4.26M | 3.95M | 5.08M |
| Intangible assets | 0.37M | 0.40M | 0.41M | 0.82M | 0.91M |
| Total liab | 47.65M | 44.06M | 40.52M | 80.61M | 117.78M |
| Total stockholder equity | -43.01M | -40.43M | -36.26M | -76.66M | -112.70M |
| Deferred long term liab | - | - | - | 0.10M | 0.17M |
| Other current liab | 0.05M | 0.05M | 0.05M | 0.95M | 1.04M |
| Common stock | - | - | - | - | 0.14M |
| Capital stock | 0.58M | 0.58M | 0.58M | 0.14M | 0.14M |
| Retained earnings | -215.79M | -212.59M | -207.88M | -203.93M | -197.89M |
| Other liab | - | - | - | - | 0.04M |
| Other assets | - | - | - | 0.15M | 0.22M |
| Cash | 1.55M | 0.76M | 1.15M | 0.52M | 0.66M |
| Total current liabilities | 46.69M | 43.80M | 40.21M | 80.28M | 89.33M |
| Net debt | 19.15M | 19.94M | 19.55M | 64.38M | 104.32M |
| Short long term debt | 20.70M | 20.70M | 20.70M | 50.70M | 77.02M |
| Property plant equipment | - | - | - | - | 1.69M |
| Total current assets | 3.21M | 2.66M | 2.94M | 1.84M | 2.18M |
| Net tangible assets | - | - | - | -77.55M | -113.69M |
| Net receivables | 1.03M | 1.00M | 1.17M | 0.95M | 0.93M |
| Long term debt | - | - | - | 14.20M | 27.96M |
| Inventory | 0.40M | 0.42M | 0.29M | 0.30M | 0.35M |
| Accounts payable | 0.31M | 0.47M | 0.60M | 0.65M | 0.41M |
| Non current assets total | 1.43M | 0.96M | 1.32M | 2.11M | 2.90M |
| Capital lease obligations | 0.82M | 0.14M | 0.33M | 0.50M | 0.65M |
| Breakdown | 2025-12-31 | 2024-12-31 | 2023-12-31 | 2022-12-31 | 2021-12-31 |
|---|---|---|---|---|---|
| Type | yearly | yearly | yearly | yearly | yearly |
| Date | 2025-12-31 | 2024-12-31 | 2023-12-31 | 2022-12-31 | 2021-12-31 |
| Investments | - | -0.14M | -0.06M | -0.01M | -0.23M |
| Change to liabilities | - | - | - | 0.00M | -0.03M |
| Total cashflows from investing activities | - | - | - | - | -0.23M |
| Net borrowings | 0.00M | -0.01M | -0.02M | 0.24M | -0.15M |
| Total cash from financing activities | 0.00M | -0.01M | -0.02M | 0.24M | -0.15M |
| Change to operating activities | - | - | - | - | 3.74M |
| Net income | -3.20M | -4.70M | -3.95M | -6.04M | -10.08M |
| Change in cash | 0.79M | -0.39M | 0.63M | -0.14M | 0.30M |
| Begin period cash flow | 0.76M | 1.15M | 0.52M | 0.66M | 0.36M |
| End period cash flow | 1.55M | 0.76M | 1.15M | 0.52M | 0.66M |
| Total cash from operating activities | 0.81M | -0.31M | 0.70M | -0.37M | 0.68M |
| Depreciation | 0.14M | 0.23M | 0.41M | 0.55M | 0.64M |
| Other cashflows from investing activities | - | - | - | - | -0.06M |
| Change to inventory | 0.02M | -0.12M | 0.01M | 0.05M | 0.06M |
| Change to account receivables | -0.03M | 0.17M | -0.22M | -0.02M | 0.21M |
| Change to netincome | - | - | - | - | 3.66M |
| Capital expenditures | 0.02M | 0.07M | 0.06M | 0.01M | 0.10M |
| Change in working capital | 3.03M | 3.45M | 3.56M | -0.08M | 3.98M |
| Stock based compensation | 0.62M | 0.53M | 0.15M | 0.23M | 0.64M |
| Other non cash items | 0.22M | 0.19M | 0.19M | 6.42M | 5.50M |
| Free cash flow | 0.79M | -0.38M | 0.64M | -0.38M | 0.51M |
Sector: Healthcare Industry: Health Information Services
|
Stock Name
|
Change
(USD) |
Price
(USD) |
Trailing
PE (x) |
Forward
PE (x) |
Price Sales
TTM (x) |
Price to Book Value (x)
|
Enterprise Value
to Revenue (x) |
Enterprise Value
to EBITDA (x) |
|---|---|---|---|---|---|---|---|---|
| CRVW Careview Comm Inc |
-0.00 0.33% |
0.03 | - | - | 2.48 | 82.56 | 4.24 | 63.43 |
| VEEV Veeva Systems Inc Class A |
-0.05 0.02% |
266.22 | 43.49 | 29.59 | 12.48 | 5.79 | 10.39 | 33.41 |
| PMCUF Pro Medicus Limited |
-6.60 5.03% |
124.50 | 64.90 | 90.91 | 49.11 | 38.05 | 65.12 | 83.47 |
| TEM Tempus AI, Inc. Class A Common Stock |
-5.60 9.39% |
54.01 | - | - | 8.68 | 25.39 | 8.33 | - |
| MTHRY M3 Inc |
-0.07 1.31% |
5.28 | 31.84 | 26.25 | 0.05 | 4.60 | 0.04 | 0.12 |
CareView Communications, Inc. provides video monitoring solutions in the United States. The company offers CareView Patient Safety System, a video monitoring tool to enhance the practice of nursing, create a better work environment, and make the patient's hospital stay more satisfying, which is used in hospitals, nursing homes, adult living centers, and outpatient care facilities; and CareView Connect, a platform consisting of several products and applications targeted at enhancing the level of care and efficiency; an array of wearable and stationary buttons that allow a resident to summon help either for an emergency or assistance; a mobile app capable of delivering an alert to the caregiver and allows them document information around that alert; and alert management and monitoring system that provides a suite of hardware and software to facilitate a data-driven solution for alert management and monitoring. It also provides Caregiver Platform that offers caregiver connect mobile application to provide an interface to capture critical workflows, such as acknowledging and documenting alert presses by the resident. In addition, the company offers SitterView and TeleMedView that allow hospital staff to use CareView's video cameras to observe and communicate with patients remotely. CareView Communications, Inc. is based in Lewisville, Texas.

405 State Highway 121, Lewisville, TX, United States, 75067

972 943 6050

52
| Name | Title | Year Born |
|---|---|---|
| Mr. Steven G. Johnson | CEO, Pres, Sec., Treasurer & Director | 1959 |
| Mr. Jason T. Thompson | Principal Financial Officer, Chief Accounting Officer & Director | 1975 |
| Ms. Sandra K. McRee | Chief Operating Officer | 1956 |
| Mr. Matthew E. Jackson | Gen. Counsel | NA |
| Mr. Brennan Howes | VP of Bus. Devel. | NA |
| Mr. Kyle B. Johnson | Director of Engineering | NA |
| Mr. Steven G. Johnson | CEO, President, Secretary, Treasurer & Director | 1959 |
| Mr. Derek del Carpio | Chief Product & Technology Officer | NA |
| Mr. Matthew E. Jackson Esq. | General Counsel | NA |
| Ms. Cathy Story MBA, RN | Chief Clinical Officer | NA |
Disclaimer - (*)This information, including any data, is sourced from Unicorn Data Services SAS, trading as EOD Historical Data (“EODHD”) on an ‘as is’ basis, using their API. We cannot guarantee the completeness or validity of the information and data provided on this page, as well as via the API. In some cases, the data may include analyst ratings or recommendations sourced through the EODHD API, which are intended solely for general information purposes.
This information does not consider your personal objectives, financial situation, or needs. Kalkine is not liable for any errors or omissions in the information provided or for any actions taken in reliance on it. You should seek advice from a financial adviser, stockbroker or other professional adviser (including taxation and legal advice) as necessary before acting on this information.

Download a free report with stock ideas and industry insights for general information.
Download Free Report Now →


Basic Materials
 -2.93%
Communication Services
-1.00%

Consumer Cyclical
-1.11%

Consumer Defensive
-0.41%

Energy
-1.31%

Financial Services
-1.34%
Financials
-3.22%

Healthcare
-1.31%

Industrials
-1.82%

Real Estate
-0.47%

Technology
-3.76%

Utilities
-0.71%
Note: Daily price change (%) by sector excluding stocks with +/-90% daily price change. Companies above $500 million market capitalization are considered.
 Portfolio
 Watchlist


 +-%
 Please wait processing your request...