 CA
 NZ
 UK
 AU
 IND

 US


…
CanaFarma Hemp Products Corp. engages in growing, manufacturing, processing, and selling hemp oil in the United States. The company offers hemp-based products, such as chewing gum and tincture under the YOOFORIC brand. It offers its products online. The company is based in Vancouver, Canada.
Source: TradingView
The charts and visual representations are sourced from TradingView through embedded widgets. For any issues with chart display, please visit the TradingView website
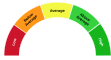
A unique technical analysis driven score developed by Kalkine showing momentum in stock prices based on select technical indicators identified.
CanaFarma Hemp Products Corp is an OTC‑listed Canadian company that states it operates in hemp‑derived consumer products and related wellness offerings. Long-term growth drivers may include expanding consumer demand for hemp‑derived cannabinoids, regulatory clarity that could broaden legal markets, and development of product and distribution channels that could support scale. Investors may find the company attractive for potential exposure to the hemp sector, though public disclosure appears limited.

Note: The summary and risk score provided above is created by AI and should not be construed as a recommendation of Kalkine.


| Breakdown | 2020-06-30 | 2019-06-30 | 2018-06-30 |
|---|---|---|---|
| Type | yearly | yearly | yearly |
| Date | 2020-06-30 | 2019-06-30 | 2018-06-30 |
| Income before tax | -18.96M | -0.03M | -0.01M |
| Minority interest | 1.16M | -0.09M | - |
| Net income | -17.80M | -0.03M | -0.01M |
| Selling general administrative | 7.14M | 0.03M | 0.01M |
| Gross profit | -2.32M | - | - |
| Reconciled depreciation | 0.20M | - | - |
| Ebit | -10.06M | -3.75M | - |
| Ebitda | -9.39M | -0.03M | -0.01M |
| Operating income | -9.60M | -0.03M | -0.01M |
| Interest expense | 0.00M | 0.00M | 0.00M |
| Tax provision | 0.00M | - | - |
| Net interest income | - | -0.00M | -0.00M |
| Income tax expense | 0.00M | 0.00M | - |
| Total revenue | 1.80M | - | - |
| Total operating expenses | 11.40M | 0.03M | 0.01M |
| Cost of revenue | 4.13M | - | - |
| Total other income expense net | -9.37M | - | - |
| Net income from continuing ops | -18.96M | -0.03M | -0.01M |
| Net income applicable to common shares | -17.80M | -3.48M | - |
| Breakdown | 2020-06-30 | 2019-06-30 | 2018-06-30 |
|---|---|---|---|
| Type | yearly | yearly | yearly |
| Date | 2020-06-30 | 2019-06-30 | 2018-06-30 |
| Total assets | 6.76M | 0.00M | 0.01M |
| Intangible assets | 0.77M | - | - |
| Other current assets | 0.32M | 1.17M | - |
| Total liab | 6.86M | 0.01M | 0.00M |
| Total stockholder equity | -0.10M | -0.01M | 0.01M |
| Other current liab | 5.63M | 0.17M | - |
| Common stock | 22.79M | 5.74M | - |
| Capital stock | 22.79M | 0.02M | - |
| Retained earnings | -20.21M | -1.16M | -0.01M |
| Cash | 1.01M | 0.00M | 0.01M |
| Total current liabilities | 6.86M | 0.48M | 0.00M |
| Net debt | - | 0.00M | - |
| Short long term debt | - | 0.00M | 0.00M |
| Other stockholder equity | -2.68M | - | - |
| Property plant equipment | 0.69M | 0.15M | - |
| Total current assets | 5.30M | 3.92M | 0.01M |
| Net tangible assets | -0.87M | 3.67M | - |
| Net receivables | 3.80M | 0.05M | - |
| Inventory | 0.10M | 0.52M | - |
| Accounts payable | 1.08M | 0.02M | 0.00M |
| Non current assets total | 1.46M | 0.00M | 0.00M |
| Breakdown | 2020-06-30 | 2019-06-30 | 2018-06-30 |
|---|---|---|---|
| Type | yearly | yearly | yearly |
| Date | 2020-06-30 | 2019-06-30 | 2018-06-30 |
| Investments | -0.66M | 0.00M | 0.00M |
| Change to liabilities | 1.13M | 0.07M | - |
| Total cashflows from investing activities | -0.66M | -1.38M | - |
| Total cash from financing activities | 6.38M | 14.53M | 0.02M |
| Change to operating activities | 0.02M | -6.95M | - |
| Net income | -17.80M | -3.48M | -0.01M |
| Change in cash | -0.25M | 3.78M | 0.01M |
| Begin period cash flow | 1.26M | 0.01M | 0.00M |
| End period cash flow | 1.01M | 1.26M | 0.01M |
| Total cash from operating activities | -5.99M | -9.38M | -0.01M |
| Issuance of capital stock | 6.38M | 0.00M | - |
| Depreciation | 0.07M | 0.07M | - |
| Change to inventory | -0.10M | -0.02M | - |
| Change to account receivables | -0.00M | -0.15M | - |
| Other cashflows from financing activities | - | -0.12M | - |
| Change to netincome | 10.56M | 1.04M | - |
| Capital expenditures | 0.66M | 0.06M | 0.00M |
| Change in working capital | 1.05M | 0.01M | -0.00M |
| Stock based compensation | 0.07M | - | - |
| Other non cash items | 7.93M | - | - |
| Free cash flow | -6.65M | -0.02M | -0.01M |
Sector: Healthcare Industry: Drug Manufacturers - Specialty & Generic
|
Stock Name
|
Change
(USD) |
Price
(USD) |
Trailing
PE (x) |
Forward
PE (x) |
Price Sales
TTM (x) |
Price to Book Value (x)
|
Enterprise Value
to Revenue (x) |
Enterprise Value
to EBITDA (x) |
|---|---|---|---|---|---|---|---|---|
| CNFHF CanaFarma Hemp Products Corp |
- -% |
0.00 | - | - | 0.03 | - | 0.33 | -0.02 |
| MKKGY Merck KGaA ADR |
0.17 0.53% |
32.25 | 21.25 | 14.93 | 3.10 | 2.14 | 3.60 | 12.98 |
| MKGAF MERCK Kommanditgesellschaft auf Aktien |
- -% |
161.82 | 24.86 | 15.11 | 3.13 | 1.98 | 3.08 | 18.89 |
| TAK Takeda Pharmaceutical Co Ltd ADR |
-0.16 0.78% |
20.27 | - | 10.96 | 0.01 | 1.20 | 2.94 | 23.11 |
| TKPHF Takeda Pharmaceutical Co. Ltd. |
- -% |
41.22 | - | 10.66 | 0.01 | 1.16 | 2.94 | 23.11 |
CanaFarma Hemp Products Corp. engages in growing, manufacturing, processing, and selling hemp oil in the United States. The company offers hemp-based products, such as chewing gum and tincture under the YOOFORIC brand. It offers its products online. The company is based in Vancouver, Canada.
| Name | Title | Year Born |
|---|---|---|
| Mr. Phil Klauder | Acting Chief Financial Officer | NA |
| Mr. Tyrone Ross Jr. | VP of Communications | NA |
| Mr. Vitaly Fargesen | Sr. VP of Strategic Planning | NA |
| Mr. Igor Palatnik | Sr. VP of Product Acquisition | NA |
| Mr. Daniel Kail | Sr. VP of Product Acquisition | NA |
| Mr. Edward James Kirkham | Chief Grower | 1974 |
| Mr. Djibril Gibson Kagni | Head of Media Management | NA |
| Mr. Tyrone Ross Jr. | Vice President of Communications | NA |
| Mr. Vitaly Fargesen | Senior Vice President of Strategic Planning | NA |
| Mr. Igor Palatnik | Senior Vice President of Product Acquisition | NA |
Disclaimer - (*)This information, including any data, is sourced from Unicorn Data Services SAS, trading as EOD Historical Data (“EODHD”) on an ‘as is’ basis, using their API. We cannot guarantee the completeness or validity of the information and data provided on this page, as well as via the API. In some cases, the data may include analyst ratings or recommendations sourced through the EODHD API, which are intended solely for general information purposes.
This information does not consider your personal objectives, financial situation, or needs. Kalkine is not liable for any errors or omissions in the information provided or for any actions taken in reliance on it. You should seek advice from a financial adviser, stockbroker or other professional adviser (including taxation and legal advice) as necessary before acting on this information.

Download a free report with stock ideas and industry insights for general information.
Download Free Report Now →


Basic Materials
 +1.59%
Communication Services
+0.05%

Consumer Cyclical
+0.14%

Consumer Defensive
 -0.43%

Energy
-0.03%

Financial Services
+0.19%
Financials
-0.35%

Healthcare
+1.05%

Industrials
+0.67%

Real Estate
-0.25%

Technology
+1.31%

Utilities
+0.32%
Note: Daily price change (%) by sector excluding stocks with +/-90% daily price change. Companies above $500 million market capitalization are considered.
 Portfolio
 Watchlist


 Please wait processing your request...