 CA
 NZ
 UK
 AU
 IND

 US


…
Balfour Beatty plc finances, designs, develops, builds, and maintains infrastructure in the United Kingdom, the United States, and internationally. It operates through three segments: Construction Services, Support Services, and Infrastructure Investments. The company constructs buildings, including commercial, healthcare, education, retail, and residential assets; and infrastructure assets comprising highways and railways, as well as other large-scale infrastructure assets, such as waste, water, and energy plants. It also offers a range of services, including design and/or build, mechanical and electrical engineering, shell and core and/or fit-out, and interior refurbishment; support services to various utility assets comprising servicing of power transmission and distribution assets, as well as construction and maintenance of electricity networks, including replacement or new build of overhead lines, underground cabling, cable tunnels, and offshore wind farm maintenance; and maintenance, asset and network management, and design services for highways, railways, and other assets. In addition, the company operates a portfolio of service concession assets comprising roads, healthcare, student accommodation, biomass, and waste and offshore transmission sectors; offers real estate management services, such as property development and asset management services; and develops housing units on land. Balfour Beatty plc was founded in 1909 and is based in London, the United Kingdom.
Source: TradingView
The charts and visual representations are sourced from TradingView through embedded widgets. For any issues with chart display, please visit the TradingView website
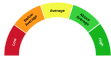
A unique technical analysis driven score developed by Kalkine showing momentum in stock prices based on select technical indicators identified.
BLFBY (Pink:BLFBY) is an OTC-listed issuer for which public disclosures and reliable operational details are minimal or unavailable. Because material information on its business model, markets, and financial condition is sparse, long-term growth drivers cannot be clearly identified; investors may find the stock attractive only for speculative exposure to a thinly traded OTC equity if they accept high information risk.
The primary investment risks are extreme information and liquidity risk, possible absence of audited financial statements, limited regulatory oversight typical of OTC listings, and heightened operational and corporate-governance uncertainty.

Note: The summary and risk score provided above is created by AI and should not be construed as a recommendation of Kalkine.


| Breakdown | 2023-12-31 | 2022-12-31 | 2021-12-31 | 2020-12-31 |
|---|---|---|---|---|
| Type | yearly | yearly | yearly | yearly |
| Date | 2023-12-31 | 2022-12-31 | 2021-12-31 | 2020-12-31 |
| Income before tax | - | 287.00M | 87.00M | 48.00M |
| Minority interest | - | 1.00M | 1.00M | 0.00M |
| Net income | - | 288.00M | 140.00M | 30.00M |
| Gross profit | - | 427.00M | 281.00M | 239.00M |
| Reconciled depreciation | - | 111.00M | 109.00M | 99.00M |
| Operating income | - | 170.00M | 14.00M | 9.00M |
| Interest expense | - | 32.00M | 39.00M | 29.00M |
| Tax provision | - | 0.00M | -52.00M | 18.00M |
| Interest income | 81.00M | 44.00M | 30.00M | 38.00M |
| Net interest income | 33.00M | 8.00M | -15.00M | -2.00M |
| Total revenue | - | 7629.00M | 7185.00M | 7320.00M |
| Total operating expenses | - | 7459.00M | 7171.00M | 7311.00M |
| Cost of revenue | - | 7202.00M | 6904.00M | 7081.00M |
| Net income from continuing ops | - | 287.00M | 139.00M | 30.00M |
| Breakdown | 2022-12-31 | 2021-12-31 | 2020-12-31 | 2019-12-31 |
|---|---|---|---|---|
| Type | yearly | yearly | yearly | yearly |
| Date | 2022-12-31 | 2021-12-31 | 2020-12-31 | 2019-12-31 |
| Total assets | 5123.00M | 4846.00M | 4685.00M | 4841.00M |
| Intangible assets | 292.00M | 296.00M | 312.00M | 300.00M |
| Total liab | 3740.00M | 3470.00M | 3340.00M | 3464.00M |
| Total stockholder equity | 1378.00M | 1369.00M | 1336.00M | 1368.00M |
| Other current liab | - | - | - | 110.00M |
| Capital stock | 294.00M | 345.00M | 345.00M | 345.00M |
| Retained earnings | 706.00M | 631.00M | 612.00M | 748.00M |
| Good will | 876.00M | 817.00M | 811.00M | 828.00M |
| Cash | 1160.00M | 1016.00M | 770.00M | 653.00M |
| Total current liabilities | 2722.00M | 2399.00M | 2198.00M | 2353.00M |
| Short long term debt | 203.00M | 39.00M | 6.00M | 39.00M |
| Total current assets | 2481.00M | 2223.00M | 2038.00M | 2197.00M |
| Net receivables | 717.00M | 730.00M | 716.00M | 791.00M |
| Long term debt | 403.00M | 447.00M | 522.00M | 529.00M |
| Inventory | 114.00M | 104.00M | 114.00M | 101.00M |
| Accounts payable | 780.00M | 748.00M | 763.00M | 837.00M |
| Non current assets total | 2642.00M | 2623.00M | 2647.00M | 2644.00M |
| Capital lease obligations | 132.00M | 129.00M | 125.00M | 120.00M |
| Breakdown | 2022-12-31 | 2021-12-31 | 2020-12-31 | 2019-12-31 |
|---|---|---|---|---|
| Type | yearly | yearly | yearly | yearly |
| Date | 2022-12-31 | 2021-12-31 | 2020-12-31 | 2019-12-31 |
| Investments | 146.00M | 116.00M | 7.00M | 113.00M |
| Net income | 288.00M | 140.00M | 30.00M | 130.00M |
| Change in cash | 125.00M | 203.00M | 28.00M | 132.00M |
| Begin period cash flow | 999.00M | 792.00M | 778.00M | 661.00M |
| End period cash flow | 1179.00M | 999.00M | 792.00M | 778.00M |
| Total cash from operating activities | 168.00M | 353.00M | 274.00M | 211.00M |
| Depreciation | 111.00M | 109.00M | 99.00M | 91.00M |
| Dividends paid | 58.00M | 29.00M | 6.00M | 48.00M |
| Change to inventory | -6.00M | 11.00M | -14.00M | -18.00M |
| Sale purchase of stock | -176.00M | -151.00M | -120.00M | -2.00M |
| Capital expenditures | 32.00M | 37.00M | 66.00M | 82.00M |
| Change in working capital | -54.00M | 269.00M | 167.00M | 32.00M |
| Stock based compensation | 9.00M | 7.00M | 8.00M | 10.00M |
| Other non cash items | -4.00M | 1.00M | -2.00M | -1.00M |
| Free cash flow | 136.00M | 316.00M | 208.00M | 129.00M |
Sector: Industrials Industry: Engineering & Construction
|
Stock Name
|
Change
(USD) |
Price
(USD) |
Trailing
PE (x) |
Forward
PE (x) |
Price Sales
TTM (x) |
Price to Book Value (x)
|
|---|---|---|---|---|---|---|
| BLFBY Balfour Beatty plc |
- -% |
23.76 | - | - | - | - |
| VCISF VINCI SA |
- -% |
130.14 | 14.66 | 12.94 | 1.06 | 2.37 |
| VCISY Vinci SA ADR |
-0.07 0.22% |
31.81 | 14.51 | 12.97 | 1.07 | 2.38 |
| FIX Comfort Systems USA Inc |
-34.75 2.99% |
1126.88 | 57.81 | 47.39 | 6.47 | 24.14 |
| FER Ferrovial N.V. |
0.15 0.24% |
61.44 | 56.50 | 38.76 | 3.96 | 5.93 |
Balfour Beatty plc finances, designs, develops, builds, and maintains infrastructure in the United Kingdom, the United States, and internationally. It operates through three segments: Construction Services, Support Services, and Infrastructure Investments. The company constructs buildings, including commercial, healthcare, education, retail, and residential assets; and infrastructure assets comprising highways and railways, as well as other large-scale infrastructure assets, such as waste, water, and energy plants. It also offers a range of services, including design and/or build, mechanical and electrical engineering, shell and core and/or fit-out, and interior refurbishment; support services to various utility assets comprising servicing of power transmission and distribution assets, as well as construction and maintenance of electricity networks, including replacement or new build of overhead lines, underground cabling, cable tunnels, and offshore wind farm maintenance; and maintenance, asset and network management, and design services for highways, railways, and other assets. In addition, the company operates a portfolio of service concession assets comprising roads, healthcare, student accommodation, biomass, and waste and offshore transmission sectors; offers real estate management services, such as property development and asset management services; and develops housing units on land. Balfour Beatty plc was founded in 1909 and is based in London, the United Kingdom.

5 Churchill Place, London, United Kingdom, E14 5HU

44 20 7216 6800

26140
| Name | Title | Year Born |
|---|---|---|
| Mr. Leo M. Quinn BSc (Hons), MSc | Group Chief Executive & Executive Director | 1956 |
| Mr. Philip J. Harrison | CFO & Executive Director | 1961 |
| Lord William Weir | Honorary President | 1933 |
| Mr. John P. Tarpey Jr. | Chief of Organization Development | NA |
| Mr. Mark Johnnie | Chief Operating Officer | NA |
| Mr. Jon Ozanne | Chief Information Officer | NA |
| Ms. Tracey A. Wood L.L.B. | Group General Counsel & Company Secretary | 1969 |
| Ms. Leslee Mallinson | Senior Vice President of Brand & Communications | NA |
| Ms. Kellie Ajjanas | Senior Vice President of Human Resources | NA |
| Mr. Stephen J. Tarr | Chief Executive Officer of Transport, Energy & Power Major Projects | NA |
Disclaimer - (*)This information, including any data, is sourced from Unicorn Data Services SAS, trading as EOD Historical Data (“EODHD”) on an ‘as is’ basis, using their API. We cannot guarantee the completeness or validity of the information and data provided on this page, as well as via the API. In some cases, the data may include analyst ratings or recommendations sourced through the EODHD API, which are intended solely for general information purposes.
This information does not consider your personal objectives, financial situation, or needs. Kalkine is not liable for any errors or omissions in the information provided or for any actions taken in reliance on it. You should seek advice from a financial adviser, stockbroker or other professional adviser (including taxation and legal advice) as necessary before acting on this information.

Download a free report with stock ideas and industry insights for general information.
Download Free Report Now →


Basic Materials
 -1.40%
Communication Services
-0.45%

Consumer Cyclical
-0.55%

Consumer Defensive
-0.01%

Energy
-0.01%

Financial Services
-0.40%
Financials
-0.15%

Healthcare
-1.15%

Industrials
-0.46%

Real Estate
-0.29%

Technology
-1.22%

Utilities
-0.10%
Note: Daily price change (%) by sector excluding stocks with +/-90% daily price change. Companies above $500 million market capitalization are considered.
 Portfolio
 Watchlist


 +0.55%
 Please wait processing your request...