 CA
 NZ
 UK
 AU
 IND

 US


…
Société BIC SA manufactures and sells stationery, lighter, shaver, and other products worldwide. It offers ballpoint, gel ink, erasable ink, writing felt-tip, learning to write, and fountain pens; mechanical and graphite pencils; proofreaders, glues, erasers, compasses, scissors, pencil sharpeners, notebooks and diaries, and other accessories; and refills. The company also provides coloring markers, colored pencils, kits and boxes, paint markers, highlighters and whiteboards permanent, and dry-erase markers. In addition, it offers rechargeable and non-rechargeable razors for men and women; multi-purpose utility lighters, and mini and maxi lighters; and classic, permanent, and temporary tattoo markers. Further, the company provides batteries and shaving preps; and advertising and promotional products. Additionally, it is involved in the provision of delivery services; production of industrial equipment; manufacture and sale of blades; and manufacture and distribution of consumer products, as well as insurance activities. The company markets its products primarily under the BIC, BIC Cristal, 4 Couleurs, M10, Intensity, Tipp ex, Velleda, BodyMark, Wite Out, Rocketbook, Inkbox, Tattly, EZ Reach, Djeep, Tangle Teezer, Cello, AMI, BIC Kids, BIC Evolution, Lucky, BIC Soleil, Gel-Ocity, Cristal Re'New, Atlantis, ECOlutions, and other brands through a range of channels, including retail mass-market distributors, traditional stores, and office product suppliers, as well as an e-commerce site. Société BIC SA was founded in 1944 and is headquartered in Clichy, France.
Source: TradingView
The charts and visual representations are sourced from TradingView through embedded widgets. For any issues with chart display, please visit the TradingView website
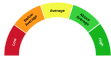
A unique technical analysis driven score developed by Kalkine showing momentum in stock prices based on select technical indicators identified.
Société BIC SA is a global consumer-products company known for disposable pens, lighters and razors sold through mass retail and e-commerce. Long-term growth may be supported by expansion in emerging markets, modest product innovation and productivity gains that could help sustain margins and steady cash generation.
Material investment risks include exposure to commodity and oil-linked input costs and foreign-exchange volatility, competition from private-label and low-cost entrants, and regulatory or safety issues affecting lighters and personal-care products.

Note: The summary and risk score provided above is created by AI and should not be construed as a recommendation of Kalkine.


| Breakdown | 2025-12-31 | 2024-12-31 | 2023-12-31 | 2022-12-31 | 2021-12-31 |
|---|---|---|---|---|---|
| Type | yearly | yearly | yearly | yearly | yearly |
| Date | 2025-12-31 | 2024-12-31 | 2023-12-31 | 2022-12-31 | 2021-12-31 |
| Income before tax | 138.95M | 297.59M | 312.97M | 290.63M | 447.79M |
| Minority interest | 0.00M | 0.00M | 0.00M | 0.00M | 0.00M |
| Net income | 85.97M | 212.01M | 226.51M | 208.88M | 314.19M |
| Selling general administrative | 564.83M | 289.30M | 285.06M | 299.69M | 220.12M |
| Selling and marketing expenses | - | 302.73M | 311.48M | 299.69M | 270.89M |
| Gross profit | 1018.62M | 1102.72M | 1148.07M | 1078.01M | 930.75M |
| Reconciled depreciation | 115.43M | 115.29M | 120.39M | 117.20M | 111.79M |
| Ebit | 155.94M | 309.23M | 322.53M | 297.79M | 278.75M |
| Ebitda | 274.90M | 424.52M | 442.92M | 414.99M | 390.54M |
| Depreciation and amortization | 118.96M | 115.29M | 120.39M | 117.20M | 111.79M |
| Operating income | 155.94M | 289.73M | 322.80M | 303.53M | 452.01M |
| Other operating expenses | 1933.28M | 1712.20M | 1942.87M | 1929.46M | 1545.11M |
| Interest expense | 16.99M | 12.44M | 10.66M | 8.59M | 3.74M |
| Tax provision | 52.82M | 85.58M | 86.46M | 81.74M | 133.59M |
| Interest income | 16.37M | 15.84M | 26.67M | 10.43M | 3.71M |
| Net interest income | -0.95M | -8.45M | 2.38M | -16.93M | -5.53M |
| Income tax expense | 52.98M | 85.58M | 86.46M | 81.74M | 133.59M |
| Total revenue | 2089.22M | 2196.64M | 2263.34M | 2233.94M | 1831.89M |
| Total operating expenses | 862.68M | 786.73M | 825.28M | 773.53M | 643.97M |
| Cost of revenue | 1070.60M | 1093.92M | 1115.27M | 1155.93M | 901.14M |
| Total other income expense net | -16.99M | 7.86M | -9.82M | -12.90M | -4.22M |
| Net income from continuing ops | 86.30M | 212.01M | 226.51M | 208.88M | 314.19M |
| Net income applicable to common shares | - | - | - | 208.90M | 314.19M |
| Breakdown | 2025-12-31 | 2024-12-31 | 2023-12-31 | 2022-12-31 | 2021-12-31 |
|---|---|---|---|---|---|
| Type | yearly | yearly | yearly | yearly | yearly |
| Date | 2025-12-31 | 2024-12-31 | 2023-12-31 | 2022-12-31 | 2021-12-31 |
| Total assets | 2612.02M | 2834.56M | 2647.34M | 2683.49M | 2495.84M |
| Intangible assets | 84.20M | 157.98M | 99.06M | 109.78M | 66.03M |
| Other current assets | 68.97M | 55.63M | 50.83M | 23.02M | 16.26M |
| Total liab | 947.64M | 1041.28M | 800.74M | 807.20M | 772.02M |
| Total stockholder equity | 1664.38M | 1793.28M | 1846.60M | 1876.29M | 1723.82M |
| Other current liab | 281.21M | 344.35M | 292.71M | 347.43M | 340.92M |
| Common stock | 156.09M | 158.99M | 161.47M | 167.90M | 170.67M |
| Capital stock | 156.09M | 158.99M | 161.47M | 167.90M | 170.67M |
| Retained earnings | 1745.59M | 1829.19M | 1841.81M | 1895.90M | 1820.29M |
| Other liab | - | - | - | 159.30M | 181.88M |
| Good will | 338.47M | 399.08M | 283.28M | 297.61M | 256.06M |
| Other assets | - | -0.00M | 0.00M | 164.50M | 0.00M |
| Cash | 460.83M | 456.04M | 467.72M | 416.32M | 468.91M |
| Total current liabilities | 597.78M | 684.64M | 586.30M | 605.08M | 566.36M |
| Current deferred revenue | - | - | 39.50M | 171.42M | 154.39M |
| Net debt | -142.95M | -121.14M | -311.53M | -296.94M | -368.85M |
| Short term debt | 163.63M | 167.39M | 109.38M | 76.54M | 76.29M |
| Short long term debt | 145.25M | 149.91M | 91.92M | 62.94M | 63.87M |
| Short long term debt total | 317.88M | 334.90M | 156.19M | 119.38M | 100.07M |
| Other stockholder equity | -236.91M | 118.50M | 117.82M | -187.51M | -267.14M |
| Property plant equipment | - | - | - | 612.60M | 588.80M |
| Total current assets | 1447.46M | 1509.73M | 1489.58M | 1498.95M | 1425.75M |
| Net tangible assets | - | - | - | 1468.90M | 1401.73M |
| Short term investments | 17.99M | 3.13M | 9.55M | 6.54M | - |
| Net receivables | 421.84M | 456.37M | 403.50M | 464.82M | 450.36M |
| Long term debt | 90.00M | 120.00M | 0.00M | 0.00M | 4.90M |
| Inventory | 477.82M | 538.56M | 557.98M | 588.26M | 490.22M |
| Accounts payable | 152.94M | 134.20M | 144.70M | 181.11M | 149.15M |
| Accumulated other comprehensive income | - | -313.41M | -274.51M | - | - |
| Non currrent assets other | 151.94M | 31.40M | 33.51M | 34.80M | 27.74M |
| Non current assets total | 1164.56M | 1324.83M | 1157.75M | 1184.53M | 1070.09M |
| Capital lease obligations | 82.26M | 64.99M | 64.27M | 56.44M | 31.31M |
| Breakdown | 2025-12-31 | 2024-12-31 | 2023-12-31 | 2022-12-31 | 2021-12-31 |
|---|---|---|---|---|---|
| Type | yearly | yearly | yearly | yearly | yearly |
| Date | 2025-12-31 | 2024-12-31 | 2023-12-31 | 2022-12-31 | 2021-12-31 |
| Investments | -6.25M | -283.71M | -114.06M | -172.46M | 0.41M |
| Change to liabilities | - | - | - | 0.00M | 41.24M |
| Total cashflows from investing activities | -59.98M | -283.71M | -114.06M | -172.50M | 57.57M |
| Net borrowings | -41.05M | 151.85M | 7.50M | -5.00M | -28.64M |
| Total cash from financing activities | -222.92M | -73.26M | -192.06M | -175.18M | -148.27M |
| Change to operating activities | - | - | - | -29.20M | 34.69M |
| Net income | 85.97M | 212.01M | 226.51M | 208.88M | 314.19M |
| Change in cash | 59.03M | -11.68M | 52.50M | -53.19M | 203.68M |
| Begin period cash flow | 401.80M | 467.72M | 415.22M | 468.41M | 264.73M |
| End period cash flow | 460.83M | 456.04M | 467.72M | 415.22M | 468.41M |
| Total cash from operating activities | 308.88M | 357.71M | 353.30M | 299.99M | 280.56M |
| Depreciation | 118.96M | 115.29M | 120.39M | 117.20M | 111.79M |
| Other cashflows from investing activities | 13.00M | -0.22M | -8.77M | -3.50M | 6.64M |
| Dividends paid | 126.95M | 177.95M | 110.22M | -94.74M | -80.92M |
| Change to inventory | 26.84M | 32.01M | 18.99M | - | -97.04M |
| Change to account receivables | - | -28.51M | -10.10M | - | 1.18M |
| Sale purchase of stock | -39.99M | -54.98M | -115.88M | -53.83M | -38.85M |
| Other cashflows from financing activities | -23.99M | 7.82M | 1.54M | -15.44M | -16.51M |
| Change to netincome | - | - | - | -7.90M | -125.50M |
| Capital expenditures | 86.97M | 87.12M | 94.33M | 83.59M | 74.87M |
| Change in working capital | -90.97M | 17.72M | -27.38M | -29.20M | -19.93M |
| Stock based compensation | 6.04M | 9.84M | 14.39M | 15.39M | 10.94M |
| Other non cash items | 194.93M | 2.85M | 19.39M | -12.28M | -136.44M |
| Free cash flow | 221.92M | 270.59M | 258.97M | 216.40M | 205.69M |
Sector: Consumer Defensive Industry: Household & Personal Products
|
Stock Name
|
Change
(USD) |
Price
(USD) |
Trailing
PE (x) |
Forward
PE (x) |
Price Sales
TTM (x) |
Price to Book Value (x)
|
Enterprise Value
to Revenue (x) |
Enterprise Value
to EBITDA (x) |
|---|---|---|---|---|---|---|---|---|
| BICEF Société BIC SA |
- -% |
76.03 | 27.78 | 12.56 | 1.32 | 1.41 | 1.04 | 8.04 |
| PG Procter & Gamble Company |
-0.09 0.05% |
167.85 | 23.58 | 22.62 | 4.07 | 7.24 | 4.40 | 16.08 |
| LRLCF L'Oréal S.A |
5.90 1.22% |
490.20 | 41.14 | 34.25 | 6.52 | 8.59 | 6.67 | 27.76 |
| LRLCY L’Oreal Co ADR |
-1.22 1.26% |
95.83 | 32.44 | 25.64 | 5.16 | 6.03 | 4.79 | 19.51 |
| UL Unilever PLC ADR |
-1.17 1.81% |
63.36 | 21.53 | 16.39 | 2.66 | 7.29 | 2.77 | 12.45 |
Société BIC SA manufactures and sells stationery, lighter, shaver, and other products worldwide. It offers ballpoint, gel ink, erasable ink, writing felt-tip, learning to write, and fountain pens; mechanical and graphite pencils; proofreaders, glues, erasers, compasses, scissors, pencil sharpeners, notebooks and diaries, and other accessories; and refills. The company also provides coloring markers, colored pencils, kits and boxes, paint markers, highlighters and whiteboards permanent, and dry-erase markers. In addition, it offers rechargeable and non-rechargeable razors for men and women; multi-purpose utility lighters, and mini and maxi lighters; and classic, permanent, and temporary tattoo markers. Further, the company provides batteries and shaving preps; and advertising and promotional products. Additionally, it is involved in the provision of delivery services; production of industrial equipment; manufacture and sale of blades; and manufacture and distribution of consumer products, as well as insurance activities. The company markets its products primarily under the BIC, BIC Cristal, 4 Couleurs, M10, Intensity, Tipp ex, Velleda, BodyMark, Wite Out, Rocketbook, Inkbox, Tattly, EZ Reach, Djeep, Tangle Teezer, Cello, AMI, BIC Kids, BIC Evolution, Lucky, BIC Soleil, Gel-Ocity, Cristal Re'New, Atlantis, ECOlutions, and other brands through a range of channels, including retail mass-market distributors, traditional stores, and office product suppliers, as well as an e-commerce site. Société BIC SA was founded in 1944 and is headquartered in Clichy, France.
| Name | Title | Year Born |
|---|---|---|
| Mr. Gonzalve Bich | CEO & Director | 1979 |
| Mr. Chad J. Spooner | Chief Financial Officer | 1972 |
| Mr. Charles Morgan | Chief Admin. Officer | NA |
| Ms. Sophie Palliez | VP of Corp. Stakeholder Engagement | NA |
| Ms. Mallory Martino | Chief HR Officer | NA |
| Mr. Thomas Brette | Group Partnerships & New Bus. Officer | NA |
| Mr. Peter Dalsberg | Group Supply Chain Officer | NA |
| Ms. Sara A. LaPorta | Chief Strategy & Bus. Devel. Officer | 1961 |
| Mr. Chester Twigg | Group Commercial Officer | NA |
| Ms. Elizabeth Maul | Group Insights, Innovation & Sustainability Officer | NA |
Disclaimer - (*)This information, including any data, is sourced from Unicorn Data Services SAS, trading as EOD Historical Data (“EODHD”) on an ‘as is’ basis, using their API. We cannot guarantee the completeness or validity of the information and data provided on this page, as well as via the API. In some cases, the data may include analyst ratings or recommendations sourced through the EODHD API, which are intended solely for general information purposes.
This information does not consider your personal objectives, financial situation, or needs. Kalkine is not liable for any errors or omissions in the information provided or for any actions taken in reliance on it. You should seek advice from a financial adviser, stockbroker or other professional adviser (including taxation and legal advice) as necessary before acting on this information.

Download a free report with stock ideas and industry insights for general information.
Download Free Report Now →


Basic Materials
 -1.14%
Communication Services
-1.25%

Consumer Cyclical
-1.10%

Consumer Defensive
-0.88%

Energy
-0.75%

Financial Services
-0.95%
Financials
-0.37%

Healthcare
-0.71%

Industrials
-0.76%

Real Estate
-0.66%

Technology
-1.57%

Utilities
-0.40%
Note: Daily price change (%) by sector excluding stocks with +/-90% daily price change. Companies above $500 million market capitalization are considered.
 Portfolio
 Watchlist


 +-%
 Please wait processing your request...