 CA
 NZ
 UK
 AU
 IND

 US


…
Agfa-Gevaert NV develops, manufactures, and markets various analog and digital systems in Belgium and internationally. The company provides healthcare's enterprise imaging platform. It also offers printers, inks, and software for sign and display and packaging printing companies; inkjet inks and fluids for various industrial inkjet applications, such as signs, displays, billboards, promotional materials, packaging, leather goods, laminated flooring, and decorative materials, as well as for printed electronics industry; electrolysis membranes to the hydrogen production industry; and printable synthetic papers and films for graphics, non-destructive testing, aerial photography, and printed circuit board production. In addition, it provides analog and digital imaging technology for diagnostic imaging market to meet the needs of specialized clinicians in hospitals and imaging centers; and X-ray film, hardcopy film and printers, digital radiography equipment, and image processing software. Further, it offers SmartXR that provides radiographers with predictive workflow assistance which includes digital radiography tools for dose, alignment, patient positioning, image rotation, and others. Additionally, the company engages in supply of film and chemicals, as well support services. It sells its products through its own sales organization, as well as through a network of agents and representatives. Agfa-Gevaert NV was founded in 1867 and is headquartered in Mortsel, Belgium.
Source: TradingView
The charts and visual representations are sourced from TradingView through embedded widgets. For any issues with chart display, please visit the TradingView website
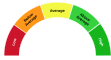
A unique technical analysis driven score developed by Kalkine showing momentum in stock prices based on select technical indicators identified.
Agfa-Gevaert NV is a Belgian technology company supplying imaging systems, software and consumables to healthcare (medical imaging and health IT) and to graphic arts (printing plates, digital printing and workflow solutions). Long-term growth drivers include healthcare digitization, recurring consumables and software revenue, and a shift in printing toward digital and packaging that may benefit its installed-base sales.
Material risks include strong competition from global med-tech and printing players, cyclicality in capital equipment spending, legacy chemical exposure and execution risk in transitioning to higher-margin digital and software offerings.

Note: The summary and risk score provided above is created by AI and should not be construed as a recommendation of Kalkine.


| Breakdown | 2025-12-31 | 2024-12-31 | 2023-12-31 | 2022-12-31 | 2021-12-31 |
|---|---|---|---|---|---|
| Type | yearly | yearly | yearly | yearly | yearly |
| Date | 2025-12-31 | 2024-12-31 | 2023-12-31 | 2022-12-31 | 2021-12-31 |
| Income before tax | -54.98M | -76.00M | -35.00M | -181.00M | 1.00M |
| Minority interest | 0.00M | 0.00M | 3.00M | 2.00M | -4.00M |
| Net income | -70.97M | -92.00M | -102.00M | -223.00M | -14.00M |
| Selling general administrative | 265.00M | 133.00M | 140.00M | 182.00M | 155.00M |
| Selling and marketing expenses | - | 162.00M | 170.00M | 249.00M | 231.00M |
| Gross profit | 327.88M | 354.00M | 358.00M | 528.00M | 497.00M |
| Reconciled depreciation | 36.00M | 42.00M | 49.00M | 63.00M | 62.00M |
| Ebit | 47.98M | -60.00M | 3.00M | -10.00M | 29.00M |
| Ebitda | 83.97M | -18.00M | 48.00M | -19.00M | 91.00M |
| Depreciation and amortization | 35.99M | 42.00M | 45.00M | -9.00M | 62.00M |
| Operating income | 47.98M | -48.00M | -8.00M | -10.00M | 29.00M |
| Other operating expenses | 1037.61M | 1186.00M | 1158.00M | 1867.00M | 1740.00M |
| Interest expense | 35.99M | 20.70M | 38.00M | 20.00M | 14.00M |
| Tax provision | 7.00M | 15.00M | 48.00M | 42.00M | 15.00M |
| Interest income | 7.00M | 11.00M | 19.00M | 11.00M | 8.00M |
| Net interest income | -21.00M | -26.00M | -17.00M | -12.00M | -6.00M |
| Income tax expense | 8.00M | 15.00M | 16.00M | 42.00M | 15.00M |
| Total revenue | 1085.59M | 1138.00M | 1150.00M | 1857.00M | 1760.00M |
| Total operating expenses | 279.90M | 402.00M | 366.00M | 538.00M | 477.00M |
| Cost of revenue | 757.72M | 784.00M | 792.00M | 1329.00M | 1263.00M |
| Total other income expense net | -102.96M | -28.00M | -27.00M | -171.00M | -28.00M |
| Net income from continuing ops | -63.00M | -91.00M | -212.00M | -223.00M | -14.00M |
| Net income applicable to common shares | - | - | - | -221.00M | -17.00M |
| Breakdown | 2025-12-31 | 2024-12-31 | 2023-12-31 | 2022-12-31 | 2021-12-31 |
|---|---|---|---|---|---|
| Type | yearly | yearly | yearly | yearly | yearly |
| Date | 2025-12-31 | 2024-12-31 | 2023-12-31 | 2022-12-31 | 2021-12-31 |
| Total assets | 1275.52M | 1377.00M | 1368.00M | 1756.00M | 2095.00M |
| Intangible assets | 34.99M | 28.00M | 24.00M | 29.00M | 12.00M |
| Other current assets | 23.99M | 118.00M | 128.00M | 14.00M | 15.00M |
| Total liab | 1020.62M | 1052.00M | 972.00M | 1195.00M | 1409.00M |
| Total stockholder equity | 253.90M | 323.00M | 395.00M | 520.00M | 632.00M |
| Other current liab | 173.93M | 209.00M | 122.00M | 312.00M | -1.00M |
| Common stock | 25.99M | 187.00M | 187.00M | 187.00M | 187.00M |
| Capital stock | 26.00M | 187.00M | 187.00M | 187.00M | 187.00M |
| Retained earnings | 990.63M | 852.00M | 945.00M | 1042.00M | 1284.00M |
| Other liab | - | - | - | 569.00M | 766.00M |
| Good will | 202.92M | 217.00M | 215.00M | 219.00M | 280.00M |
| Other assets | - | 1.00M | -30.00M | 1.00M | 257.00M |
| Cash | 90.97M | 68.00M | 77.00M | 138.00M | 398.00M |
| Total current liabilities | 402.85M | 396.00M | 388.00M | 585.00M | 597.00M |
| Current deferred revenue | 102.96M | - | 97.00M | - | 319.00M |
| Net debt | 77.97M | 88.00M | 5.00M | -73.00M | -325.00M |
| Short term debt | 16.99M | 15.00M | -83.00M | 24.00M | 27.00M |
| Short long term debt | 0.00M | 0.00M | 0.00M | 4.00M | 3.00M |
| Short long term debt total | 168.94M | 156.00M | 82.00M | 65.00M | 73.00M |
| Other stockholder equity | 161.94M | -716.00M | -737.00M | -709.00M | -839.00M |
| Property plant equipment | - | - | - | 152.00M | 197.00M |
| Total current assets | 718.73M | 793.00M | 792.00M | 1153.00M | 1339.00M |
| Net tangible assets | - | - | - | 273.00M | 339.00M |
| Short term investments | - | - | 71.00M | 1.00M | 2.00M |
| Net receivables | 349.87M | 314.00M | 298.00M | 513.00M | 506.00M |
| Long term debt | 111.00M | 105.00M | 39.00M | -1.00M | -1.00M |
| Inventory | 253.90M | 293.00M | 289.00M | 487.00M | 418.00M |
| Accounts payable | 108.96M | 127.00M | 132.00M | 249.00M | 252.00M |
| Accumulated other comprehensive income | -924.65M | - | -948.00M | - | - |
| Non currrent assets other | 73.97M | 116.00M | 148.00M | 108.00M | 134.00M |
| Non current assets total | 556.79M | 583.00M | 576.00M | 602.00M | 756.00M |
| Capital lease obligations | 58.00M | 51.00M | 43.00M | 62.00M | 71.00M |
| Breakdown | 2025-12-31 | 2024-12-31 | 2023-12-31 | 2022-12-31 | 2021-12-31 |
|---|---|---|---|---|---|
| Type | yearly | yearly | yearly | yearly | yearly |
| Date | 2025-12-31 | 2024-12-31 | 2023-12-31 | 2022-12-31 | 2021-12-31 |
| Investments | - | -29.00M | -19.00M | -76.00M | -2.00M |
| Change to liabilities | - | - | - | -15.00M | 41.00M |
| Total cashflows from investing activities | -25.99M | -29.00M | -16.00M | -76.00M | -2.00M |
| Net borrowings | 5.00M | 65.00M | 40.00M | -31.00M | -30.00M |
| Total cash from financing activities | -13.00M | 22.00M | -10.00M | -77.00M | -67.00M |
| Change to operating activities | - | - | - | -174.00M | -296.00M |
| Net income | -62.98M | -92.00M | -101.00M | -223.00M | -14.00M |
| Change in cash | 31.05M | -9.00M | -61.00M | -260.00M | -187.00M |
| Begin period cash flow | 59.91M | 77.00M | 138.00M | 398.00M | 585.00M |
| End period cash flow | 90.97M | 68.00M | 77.00M | 138.00M | 398.00M |
| Total cash from operating activities | 65.98M | -4.00M | -30.00M | -100.00M | -116.00M |
| Depreciation | 35.99M | 42.00M | 45.00M | 63.00M | 62.00M |
| Other cashflows from investing activities | - | 15.00M | 20.00M | 4.00M | 4.00M |
| Change to inventory | 22.99M | -13.00M | 23.00M | -65.00M | -48.00M |
| Change to account receivables | - | 5.00M | -12.00M | 11.00M | -2.00M |
| Sale purchase of stock | 0.00M | 0.00M | 0.00M | -21.00M | -29.00M |
| Other cashflows from financing activities | -17.99M | -43.00M | -50.00M | -52.00M | -35.00M |
| Change to netincome | - | - | - | 301.00M | 144.00M |
| Capital expenditures | 33.99M | 45.00M | 34.00M | 33.00M | 26.00M |
| Change in working capital | -71.97M | -10.00M | -157.00M | -67.00M | 7.00M |
| Stock based compensation | - | - | -0.10M | - | - |
| Other non cash items | 164.94M | 56.00M | 183.00M | 127.00M | -171.00M |
| Free cash flow | 31.99M | -49.00M | -64.00M | -133.00M | -142.00M |
Sector: Industrials Industry: Specialty Industrial Machinery
|
Stock Name
|
Change
(USD) |
Price
(USD) |
Trailing
PE (x) |
Forward
PE (x) |
Price Sales
TTM (x) |
Price to Book Value (x)
|
Enterprise Value
to Revenue (x) |
Enterprise Value
to EBITDA (x) |
|---|---|---|---|---|---|---|---|---|
| AFGVF Agfa-Gevaert NV |
- -% |
0.57 | - | 12.67 | 0.08 | 0.30 | 0.14 | 8.30 |
| GEV GE Vernova LLC |
-17.05 1.90% |
878.03 | 56.16 | 67.57 | 7.02 | 23.82 | 6.79 | 115.11 |
| SMAWF Siemens AG Class N |
4.40 1.49% |
300.00 | 25.72 | 20.16 | 2.87 | 2.96 | 2.85 | 13.79 |
| SBGSF Schneider Electric SE |
5.75 2.13% |
275.25 | 32.06 | 22.47 | 4.40 | 6.27 | 4.00 | 19.13 |
| ETN Eaton Corporation PLC |
8.68 2.26% |
392.88 | 39.21 | 30.77 | 5.80 | 8.18 | 6.15 | 27.30 |
Agfa-Gevaert NV develops, manufactures, and markets various analog and digital systems in Belgium and internationally. The company provides healthcare's enterprise imaging platform. It also offers printers, inks, and software for sign and display and packaging printing companies; inkjet inks and fluids for various industrial inkjet applications, such as signs, displays, billboards, promotional materials, packaging, leather goods, laminated flooring, and decorative materials, as well as for printed electronics industry; electrolysis membranes to the hydrogen production industry; and printable synthetic papers and films for graphics, non-destructive testing, aerial photography, and printed circuit board production. In addition, it provides analog and digital imaging technology for diagnostic imaging market to meet the needs of specialized clinicians in hospitals and imaging centers; and X-ray film, hardcopy film and printers, digital radiography equipment, and image processing software. Further, it offers SmartXR that provides radiographers with predictive workflow assistance which includes digital radiography tools for dose, alignment, patient positioning, image rotation, and others. Additionally, the company engages in supply of film and chemicals, as well support services. It sells its products through its own sales organization, as well as through a network of agents and representatives. Agfa-Gevaert NV was founded in 1867 and is headquartered in Mortsel, Belgium.
| Name | Title | Year Born |
|---|---|---|
| Mr. Pascal Juery | Pres, CEO, Pres of Radiology Solutions & Director | 1965 |
| Mr. Dirk De Man | Chief Financial Officer | NA |
| Mr. Wilfried Van Lishout | Compliance Officer & Company Sec. | 1964 |
| Ms. Viviane Dictus | Director of Corp. Communications | NA |
| Mr. Gunther Koch | Chief HR Officer | 1971 |
| Mr. - Boyer | Exec. VP | NA |
| Mr. Luc Delagaye | Pres of Offset Solutions | 1960 |
| Mr. Vincent Wille | Pres of Digital Print & Chemicals | 1976 |
| Jose Herraez | DR Global Head of Commerce | NA |
| Mr. Scott Evers | Sr. VP & North American Bus. Leader | NA |
Disclaimer - (*)This information, including any data, is sourced from Unicorn Data Services SAS, trading as EOD Historical Data (“EODHD”) on an ‘as is’ basis, using their API. We cannot guarantee the completeness or validity of the information and data provided on this page, as well as via the API. In some cases, the data may include analyst ratings or recommendations sourced through the EODHD API, which are intended solely for general information purposes.
This information does not consider your personal objectives, financial situation, or needs. Kalkine is not liable for any errors or omissions in the information provided or for any actions taken in reliance on it. You should seek advice from a financial adviser, stockbroker or other professional adviser (including taxation and legal advice) as necessary before acting on this information.

Download a free report with stock ideas and industry insights for general information.
Download Free Report Now →


Basic Materials
 +0.02%
Communication Services
 -0.63%

Consumer Cyclical
-0.11%

Consumer Defensive
-0.45%

Energy
+0.39%

Financial Services
-0.10%
Financials
-0.81%

Healthcare
+1.03%

Industrials
+0.32%

Real Estate
-0.31%

Technology
+0.59%

Utilities
-0.18%
Note: Daily price change (%) by sector excluding stocks with +/-90% daily price change. Companies above $500 million market capitalization are considered.
 Portfolio
 Watchlist


 Please wait processing your request...