 CA
 NZ
 UK
 AU
 IND

 US


…
PowerSchool Holdings, Inc., together with its subsidiaries, offers cloud-based software to the K-12 education market. Its solution embedded in school workflows and is used on daily basis by educators, students, administrators, and parents in schools and districts. In addition, the company provides cloud-based technology platform helps schools and districts manage state reporting and related compliance, special education, finance, human resource, talent, registration, attendance, funding, learning, instruction, behavior, grading, college and career readiness, assessments, and analytics. The company serves state departments of education, public school districts, charter schools, independent schools, virtual schools, and others. PowerSchool Holdings, Inc. was founded in 1997 and is headquartered in Folsom, California.
Source: TradingView
The charts and visual representations are sourced from TradingView through embedded widgets. For any issues with chart display, please visit the TradingView website
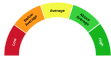
A unique technical analysis driven score developed by Kalkine showing momentum in stock prices based on select technical indicators identified.


| Breakdown | 2022-12-31 | 2021-12-31 | 2020-12-31 | 2019-12-31 |
|---|---|---|---|---|
| Type | yearly | yearly | yearly | yearly |
| Date | 2022-12-31 | 2021-12-31 | 2020-12-31 | 2019-12-31 |
| Income before tax | -40.56M | -65.48M | -46.61M | -93.38M |
| Minority interest | -6.95M | 9.30M | - | 0.00M |
| Net income | -27.74M | -43.06M | -46.65M | -90.73M |
| Selling general administrative | 178.34M | 149.17M | 92.71M | 86.92M |
| Gross profit | 358.34M | 317.74M | 243.09M | 195.00M |
| Reconciled depreciation | 122.22M | 113.48M | 95.74M | 84.14M |
| Ebit | 2.09M | 13.66M | 22.46M | -5.60M |
| Ebitda | 124.31M | 127.14M | 120.34M | 78.54M |
| Depreciation and amortization | 122.22M | 113.48M | 97.88M | 84.14M |
| Non operating income net other | 1.34M | -12.26M | - | - |
| Operating income | 2.09M | 13.66M | 22.46M | -5.60M |
| Other operating expenses | 622.15M | 545.58M | 409.93M | 370.38M |
| Interest expense | 40.01M | 58.94M | 68.71M | 85.26M |
| Tax provision | -12.81M | -22.41M | 0.04M | -2.65M |
| Net interest income | -40.01M | -58.94M | -68.71M | -85.26M |
| Non recurring | 2.63M | 7.30M | - | - |
| Income tax expense | -12.81M | -22.41M | 0.04M | -2.65M |
| Total revenue | 630.68M | 558.60M | 434.89M | 364.99M |
| Total operating expenses | 349.80M | 304.73M | 218.13M | 200.40M |
| Cost of revenue | 272.35M | 240.86M | 191.80M | 169.99M |
| Total other income expense net | -42.64M | -79.14M | -69.07M | -87.78M |
| Net income from continuing ops | -27.36M | -43.06M | -46.65M | -90.73M |
| Net income applicable to common shares | -20.79M | -33.77M | -46.65M | -90.73M |
| Breakdown | 2022-12-31 | 2021-12-31 | 2020-12-31 | 2019-12-31 |
|---|---|---|---|---|
| Type | yearly | yearly | yearly | yearly |
| Date | 2022-12-31 | 2021-12-31 | 2020-12-31 | 2019-12-31 |
| Total assets | 3583.39M | 3556.68M | 3200.70M | 3169.70M |
| Intangible assets | 823.01M | 885.52M | 822.35M | 855.41M |
| Other current assets | 36.89M | 38.42M | 22.80M | 19.03M |
| Total liab | 1849.45M | 1833.72M | 1522.83M | 1450.14M |
| Total stockholder equity | 1248.67M | 1234.74M | 1677.87M | 1719.57M |
| Deferred long term liab | 23.84M | 18.45M | 14.55M | 7.61M |
| Other current liab | 84.27M | 71.17M | 53.70M | 52.00M |
| Common stock | 0.02M | 0.02M | 1855.73M | 1851.13M |
| Capital stock | 0.02M | 0.02M | 1855.73M | 1851.13M |
| Retained earnings | -187.25M | -165.03M | -178.30M | -131.65M |
| Other liab | 699.08M | 714.66M | 19.59M | 20.59M |
| Good will | 2487.01M | 2454.69M | 2213.37M | 2161.50M |
| Other assets | 29.68M | 27.49M | 24.40M | 18.44M |
| Cash | 137.47M | 86.48M | 52.73M | 38.99M |
| Total current liabilities | 413.70M | 385.64M | 342.92M | 265.89M |
| Current deferred revenue | 310.54M | 294.28M | 229.62M | 193.84M |
| Net debt | 612.22M | 654.70M | 1156.04M | 1132.95M |
| Short term debt | 13.01M | 7.75M | 48.45M | 8.28M |
| Short long term debt | 7.75M | 7.75M | 48.45M | 8.28M |
| Short long term debt total | 749.69M | 741.17M | 1208.78M | 1171.94M |
| Other stockholder equity | 1438.02M | 1399.97M | 0.44M | 0.09M |
| Property plant equipment | 6.17M | 15.68M | 17.07M | 21.70M |
| Total current assets | 228.65M | 173.31M | 123.51M | 112.65M |
| Net tangible assets | 526.52M | -2105.47M | -1357.85M | -1297.34M |
| Net receivables | 54.30M | 48.40M | 47.98M | 54.63M |
| Long term debt | 728.62M | 733.42M | 1160.33M | 1163.66M |
| Accounts payable | 5.88M | 12.45M | 11.14M | 11.78M |
| Noncontrolling interest in consolidated entity | 485.28M | 488.21M | - | - |
| Accumulated other comprehensive income | -2.12M | -0.22M | 0.44M | 0.09M |
| Common stock total equity | 0.02M | 0.02M | 1855.73M | 1851.13M |
| Retained earnings total equity | -187.25M | -165.03M | - | - |
| Non currrent assets other | 29.68M | 27.49M | 24.40M | 18.44M |
| Non current assets total | 3354.74M | 3383.38M | 3077.19M | 3057.05M |
| Capital lease obligations | 13.32M | - | - | - |
| Long term debt total | 728.62M | 733.42M | - | - |
| Breakdown | 2022-12-31 | 2021-12-31 | 2020-12-31 | 2019-12-31 |
|---|---|---|---|---|
| Type | yearly | yearly | yearly | yearly |
| Date | 2022-12-31 | 2021-12-31 | 2020-12-31 | 2019-12-31 |
| Investments | -77.65M | -373.50M | -107.31M | -200.83M |
| Change to liabilities | -0.46M | 16.60M | 27.07M | 19.98M |
| Total cashflows from investing activities | -77.65M | -373.50M | -107.31M | -200.83M |
| Net borrowings | -7.75M | -486.35M | 31.69M | 60.78M |
| Total cash from financing activities | -19.23M | 264.70M | 30.70M | 153.22M |
| Change to operating activities | 4.46M | 0.43M | -10.01M | 4.75M |
| Net income | -27.74M | -43.06M | -46.65M | -90.73M |
| Change in cash | 50.99M | 33.74M | 13.76M | 7.56M |
| Begin period cash flow | 86.99M | 53.25M | 39.49M | 31.93M |
| End period cash flow | 137.98M | 86.99M | 53.25M | 39.49M |
| Total cash from operating activities | 149.01M | 143.10M | 89.49M | 54.32M |
| Issuance of capital stock | 0.00M | 766.08M | 0.00M | 0.00M |
| Depreciation | 122.22M | 113.48M | 95.74M | 84.14M |
| Other cashflows from investing activities | -74.00M | -369.51M | - | - |
| Change to inventory | - | 0.43M | -10.01M | 4.75M |
| Change to account receivables | -5.97M | 7.30M | 11.57M | 24.62M |
| Sale purchase of stock | -0.29M | 754.32M | -0.99M | 0.00M |
| Other cashflows from financing activities | 58.52M | 355.18M | 100.97M | 211.03M |
| Change to netincome | 49.65M | 29.96M | 6.26M | 6.38M |
| Capital expenditures | 45.11M | 39.91M | 31.63M | 34.94M |
| Change receivables | -5.97M | 7.30M | - | - |
| Cash flows other operating | 11.32M | 52.17M | - | - |
| Cash and cash equivalents changes | 52.13M | 34.30M | - | - |
| Change in working capital | -10.39M | 24.33M | 28.63M | 49.35M |
| Stock based compensation | 50.27M | 25.14M | 5.59M | 5.83M |
| Other non cash items | 29.92M | 9.10M | 5.50M | 5.18M |
| Free cash flow | 103.90M | 103.19M | 57.86M | 19.38M |
Sector: Technology Industry: Software - Application
|
Stock Name
|
Change
(USD) |
Price
(USD) |
Trailing
PE (x) |
Forward
PE (x) |
Price Sales
TTM (x) |
Price to Book Value (x)
|
Enterprise Value
to Revenue (x) |
Enterprise Value
to EBITDA (x) |
|---|---|---|---|---|---|---|---|---|
| SAP SAP SE ADR |
0.86 0.37% |
234.92 | 28.16 | 22.42 | 6.52 | 4.85 | 5.60 | 16.61 |
| CRM Salesforce Inc |
0.27 0.12% |
217.84 | 23.41 | 15.55 | 4.79 | 5.56 | 5.55 | 14.88 |
| SAPGF SAP SE |
- -% |
234.00 | 76.28 | 22.88 | 5.61 | 3.84 | 5.59 | 26.18 |
| SHOP Shopify Inc |
0.31 0.21% |
147.09 | 90.18 | 53.19 | 12.70 | 13.17 | 12.23 | 67.86 |
PowerSchool Holdings, Inc., together with its subsidiaries, offers cloud-based software to the K-12 education market. Its solution embedded in school workflows and is used on daily basis by educators, students, administrators, and parents in schools and districts. In addition, the company provides cloud-based technology platform helps schools and districts manage state reporting and related compliance, special education, finance, human resource, talent, registration, attendance, funding, learning, instruction, behavior, grading, college and career readiness, assessments, and analytics. The company serves state departments of education, public school districts, charter schools, independent schools, virtual schools, and others. PowerSchool Holdings, Inc. was founded in 1997 and is headquartered in Folsom, California.
| Name | Title | Year Born |
|---|---|---|
| Mr. Hardeep Singh Gulati | CEO & Director | 1976 |
| Mr. Eric R. Shander | Pres & CFO | 1969 |
| Ms. Angelina Deasy Hendraka | Chief Accounting Officer | NA |
| Mr. Devendra Singh | Chief Technology Officer | 1966 |
| Shane Harrison | Sr. VP of Investor Relations | NA |
| Mr. Michael C. Bisignano | Chief Legal Officer & Corp. Sec. | 1971 |
| Mr. Darron Flagg | Chief Compliance & Privacy Officer | NA |
| Mr. Fred Studer | Chief Marketing Officer | NA |
| Ms. Marcy Daniel | Chief Product Officer | 1972 |
| Mr. Joshua Gibbs | Chief of Staff | NA |
Disclaimer - (*)This information, including any data, is sourced from Unicorn Data Services SAS, trading as EOD Historical Data (“EODHD”) on an ‘as is’ basis, using their API. We cannot guarantee the completeness or validity of the information and data provided on this page, as well as via the API. In some cases, the data may include analyst ratings or recommendations sourced through the EODHD API, which are intended solely for general information purposes.
This information does not consider your personal objectives, financial situation, or needs. Kalkine is not liable for any errors or omissions in the information provided or for any actions taken in reliance on it. You should seek advice from a financial adviser, stockbroker or other professional adviser (including taxation and legal advice) as necessary before acting on this information.

Download a free report with stock ideas and industry insights for general information.
Download Free Report Now →


Basic Materials
 -1.02%
Communication Services
 +0.42%

Consumer Cyclical
+0.04%

Consumer Defensive
+0.52%

Energy
+0.40%

Financial Services
+0.10%
Financials
-0.27%

Healthcare
-0.31%

Industrials
-0.44%

Real Estate
+0.05%

Technology
-1.04%

Utilities
+0.19%
Note: Daily price change (%) by sector excluding stocks with +/-90% daily price change. Companies above $500 million market capitalization are considered.
 Portfolio
 Watchlist


 Please wait processing your request...