 CA
 NZ
 UK
 AU
 IND

 US


…
Pfizer Inc. discovers, develops, manufactures, markets, distributes, and sells biopharmaceutical products worldwide. It offers medicines and vaccines in various therapeutic areas, including cardiovascular metabolic, migraine, and women's health under the Eliquis, Nurtec ODT/Vydura, and the Premarin family brands; infectious diseases with unmet medical needs under the Prevnar family, Nimenrix, FSME/IMMUN-TicoVac, and Trumenba brands; and COVID-19 prevention and treatment, and potential future mRNA and antiviral products under the Comirnaty and Paxlovid brands. The company also provides medicines and vaccines in various therapeutic areas, such as biosimilars for chronic immune and inflammatory diseases under the Xeljanz, Enbrel, Inflectra, Eucrisa/Staquis, and Cibinqo brands; amyloidosis, hemophilia, endocrine diseases, and sickle cell disease under the Vyndaqel family, Oxbryta, BeneFIX, and Genotropin brands; sterile injectable and anti-infective medicines under the Sulperazon, Medrol, Zavicefta, Zithromax, Vfend, and Panzyga brands; and biologics, small molecules, immunotherapies, and biosimilars under the Ibrance, Xtandi, Inlyta, Retacrit, Lorbrena, and Braftovi brands. In addition, the company is involved in the contract manufacturing business. It serves wholesalers, retailers, hospitals, clinics, government agencies, pharmacies, individual provider offices, retail pharmacies, and integrated delivery systems, as well as disease control and prevention centers. The company has collaboration agreements with Bristol-Myers Squibb Company; Astellas Pharma US, Inc.; Myovant Sciences Ltd.; Merck KGaA; Valneva SE; BioNTech SE; and Arvinas, Inc., as well as strategic partnership with CSPC Pharmaceutical Group Limited to launch a local brand of the COVID-19 oral therapeutic treatment Nirmatrelvir/Ritonavir in China, and a collaboration with Carrick Therapeutics Limited. Pfizer Inc. was founded in 1849 and is headquartered in New York, New York.
Source: TradingView
The charts and visual representations are sourced from TradingView through embedded widgets. For any issues with chart display, please visit the TradingView website
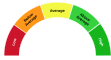
A unique technical analysis driven score developed by Kalkine showing momentum in stock prices based on select technical indicators identified.
Pfizer is a global pharmaceutical company that discovers, develops and commercializes vaccines and prescription medicines across infectious disease, oncology, rare disease and inflammation. Long-term growth may be supported by its established vaccine franchise, new product launches and a broad drug-development pipeline combined with global commercial scale. The company's cash generation and dividend history could make it attractive to investors seeking exposure to a diversified large-cap biopharma.
Key risks include loss of exclusivity and generic or biosimilar competition, pricing and regulatory pressures in major markets, variable demand for pandemic-related products and execution risk in advancing and commercializing new therapies.

Note: The summary and risk score provided above is created by AI and should not be construed as a recommendation of Kalkine.


| Breakdown | 2022-12-31 | 2021-12-31 | 2020-12-31 | 2019-12-31 | 2018-12-31 |
|---|---|---|---|---|---|
| Type | yearly | yearly | yearly | yearly | yearly |
| Date | 2022-12-31 | 2021-12-31 | 2020-12-31 | 2019-12-31 | 2018-12-31 |
| Income before tax | 34729.00M | 24311.00M | 7497.00M | 17682.00M | 11885.00M |
| Minority interest | -35.00M | -45.00M | 36.00M | 29.00M | 36.00M |
| Net income | 31372.00M | 21979.00M | 7020.00M | 16273.00M | 11153.00M |
| Selling general administrative | 14305.00M | 12253.00M | 11615.00M | 14350.00M | 14455.00M |
| Selling and marketing expenses | - | - | 197.00M | - | - |
| Gross profit | 65986.00M | 50467.00M | 33216.00M | 41531.00M | 42399.00M |
| Reconciled depreciation | 3609.00M | 3700.00M | 4777.00M | 6010.00M | 6384.00M |
| Ebit | 40030.00M | 24833.00M | 10630.00M | 15137.00M | 16519.00M |
| Ebitda | 43639.00M | 28533.00M | 14066.00M | 19747.00M | 21412.00M |
| Depreciation and amortization | 3609.00M | 3700.00M | 3436.00M | 4610.00M | 4893.00M |
| Non operating income net other | -217.00M | 4878.00M | -663.00M | 4508.00M | -2116.00M |
| Operating income | 40030.00M | 24833.00M | 10630.00M | 15137.00M | 15045.00M |
| Other operating expenses | 63058.00M | 61053.00M | 33148.00M | 37829.00M | 38602.00M |
| Interest expense | 1238.00M | 1291.00M | 1449.00M | 1574.00M | 1316.00M |
| Tax provision | 3328.00M | 1852.00M | 477.00M | 1384.00M | 706.00M |
| Interest income | 1824.00M | 560.00M | 538.00M | 226.00M | 333.00M |
| Net interest income | -987.00M | -1255.00M | -1376.00M | -1348.00M | -983.00M |
| Extraordinary items | 6.00M | -434.00M | 2631.00M | 326.00M | 806.00M |
| Non recurring | 2328.00M | 802.00M | 600.00M | 747.00M | 1044.00M |
| Income tax expense | 3328.00M | 1852.00M | 477.00M | 1384.00M | 706.00M |
| Total revenue | 100330.00M | 81288.00M | 41908.00M | 51750.00M | 53647.00M |
| Total operating expenses | 28714.00M | 30232.00M | 24456.00M | 27610.00M | 27354.00M |
| Cost of revenue | 34344.00M | 30821.00M | 8692.00M | 10219.00M | 11248.00M |
| Total other income expense net | -5301.00M | -522.00M | -3133.00M | 2545.00M | -2178.00M |
| Discontinued operations | 6.00M | -434.00M | 2631.00M | 4.00M | 10.00M |
| Net income from continuing ops | 31401.00M | 22459.00M | 7021.00M | 16298.00M | 11179.00M |
| Net income applicable to common shares | 31372.00M | 21979.00M | 9616.00M | 16273.00M | 11153.00M |
| Breakdown | 2022-12-31 | 2021-12-31 | 2020-12-31 | 2019-12-31 | 2018-12-31 |
|---|---|---|---|---|---|
| Type | yearly | yearly | yearly | yearly | yearly |
| Date | 2022-12-31 | 2021-12-31 | 2020-12-31 | 2019-12-31 | 2018-12-31 |
| Total assets | 197206.00M | 181477.00M | 154229.00M | 167488.00M | 159422.00M |
| Intangible assets | 43370.00M | 25146.00M | 28472.00M | 35369.00M | 35211.00M |
| Other current assets | 5017.00M | 3820.00M | 3439.00M | 2601.00M | 2461.00M |
| Total liab | 101289.00M | 104014.00M | 90756.00M | 104042.00M | 95664.00M |
| Total stockholder equity | 95661.00M | 77201.00M | 63238.00M | 63143.00M | 63407.00M |
| Deferred long term liab | 1023.00M | 349.00M | 4063.00M | 5578.00M | 3700.00M |
| Other current liab | 29864.00M | 31785.00M | 12639.00M | 11090.00M | 12639.00M |
| Common stock | 476.00M | 473.00M | 470.00M | 468.00M | 467.00M |
| Capital stock | 476.00M | 473.00M | 470.00M | 485.00M | 486.00M |
| Retained earnings | 125656.00M | 103394.00M | 96770.00M | 97670.00M | 89554.00M |
| Other liab | 23348.00M | 22637.00M | 26589.00M | 29736.00M | 30519.00M |
| Good will | 51375.00M | 49208.00M | 49577.00M | 58653.00M | 53411.00M |
| Other assets | 3.00M | 2.00M | -1.00M | 1.00M | -1.00M |
| Cash | 416.00M | 1944.00M | 1784.00M | 1305.00M | 1139.00M |
| Cash and equivalents | 416.00M | 1944.00M | 1784.00M | 1121.00M | 1139.00M |
| Total current liabilities | 42138.00M | 42671.00M | 25920.00M | 37304.00M | 31858.00M |
| Current deferred revenue | 2520.00M | 3067.00M | 6269.00M | 5804.00M | 5709.00M |
| Net debt | 34454.00M | 35054.00M | 36490.00M | 50840.00M | 40126.00M |
| Short term debt | 2945.00M | 2241.00M | 2703.00M | 16190.00M | 8836.00M |
| Short long term debt | 2945.00M | 2241.00M | 2703.00M | 16195.00M | 8831.00M |
| Short long term debt total | 34870.00M | 36998.00M | 38274.00M | 52145.00M | 41265.00M |
| Other stockholder equity | -22167.00M | -20769.00M | -22314.00M | -23372.00M | -15358.00M |
| Property plant equipment | 19276.00M | 17721.00M | 13900.00M | 13967.00M | 13385.00M |
| Total current assets | 51259.00M | 59693.00M | 35067.00M | 32803.00M | 49926.00M |
| Long term investments | 15069.00M | 21526.00M | 20262.00M | 20147.00M | 2767.00M |
| Net tangible assets | 95661.00M | -104.00M | 63238.00M | -30896.00M | -25656.00M |
| Short term investments | 22316.00M | 29125.00M | 10437.00M | 8525.00M | 17694.00M |
| Net receivables | 14529.00M | 15745.00M | 11194.00M | 12068.00M | 11399.00M |
| Long term debt | 32884.00M | 36195.00M | 37133.00M | 35955.00M | 32909.00M |
| Inventory | 8981.00M | 9059.00M | 8046.00M | 8283.00M | 7508.00M |
| Accounts payable | 6809.00M | 5578.00M | 4309.00M | 4220.00M | 4674.00M |
| Noncontrolling interest in consolidated entity | 256.00M | 262.00M | 235.00M | 303.00M | 351.00M |
| Accumulated other comprehensive income | -8304.00M | -5897.00M | -11688.00M | -11640.00M | -11275.00M |
| Common stock total equity | 476.00M | 473.00M | 470.00M | 468.00M | 467.00M |
| Preferred stock total equity | - | - | - | 17.00M | 19.00M |
| Retained earnings total equity | 125656.00M | 103394.00M | 96770.00M | 97670.00M | 89554.00M |
| Treasury stock | -113969.00M | -111361.00M | -110988.00M | -110801.00M | -101610.00M |
| Non currrent assets other | 13163.00M | 7679.00M | 4569.00M | 4450.00M | 2799.00M |
| Non current assets total | 145944.00M | 121782.00M | 119163.00M | 134685.00M | 109497.00M |
| Long term debt total | 32884.00M | 36195.00M | 37133.00M | 35955.00M | 32909.00M |
| Breakdown | 2022-12-31 | 2021-12-31 | 2020-12-31 | 2019-12-31 | 2018-12-31 |
|---|---|---|---|---|---|
| Type | yearly | yearly | yearly | yearly | yearly |
| Date | 2022-12-31 | 2021-12-31 | 2020-12-31 | 2019-12-31 | 2018-12-31 |
| Investments | 11125.00M | -19517.00M | -2592.00M | 9304.00M | 6434.00M |
| Change to liabilities | -803.00M | 1242.00M | 1856.00M | -3034.00M | 451.00M |
| Total cashflows from investing activities | -15783.00M | -22546.00M | -4271.00M | -3945.00M | 4525.00M |
| Net borrowings | -3516.00M | -1103.00M | -12755.00M | 8764.00M | -935.00M |
| Total cash from financing activities | -14834.00M | -9816.00M | -9649.00M | -8485.00M | -20441.00M |
| Change to operating activities | -6500.00M | 16498.00M | 1357.00M | -1675.00M | 4.00M |
| Net income | 31401.00M | 22459.00M | 7021.00M | 16302.00M | 11188.00M |
| Change in cash | -1515.00M | 158.00M | 475.00M | 125.00M | -206.00M |
| Begin period cash flow | 1983.00M | 1825.00M | 1350.00M | 1225.00M | 1431.00M |
| End period cash flow | 468.00M | 1983.00M | 1825.00M | 1350.00M | 1225.00M |
| Total cash from operating activities | 29267.00M | 32580.00M | 14403.00M | 12588.00M | 15827.00M |
| Depreciation | 5064.00M | 5191.00M | 4777.00M | 6010.00M | 6384.00M |
| Other cashflows from investing activities | -12547.00M | -318.00M | 573.00M | -11074.00M | 134.00M |
| Dividends paid | -8983.00M | -8729.00M | -8440.00M | -8043.00M | 7978.00M |
| Change to inventory | 592.00M | -1125.00M | -736.00M | -1050.00M | -717.00M |
| Change to account receivables | 261.00M | -3811.00M | -1249.00M | -742.00M | -644.00M |
| Sale purchase of stock | -2000.00M | 0.00M | 425.00M | -8865.00M | -12198.00M |
| Other cashflows from financing activities | 3556.00M | 1013.00M | 29120.00M | -735.00M | -589.00M |
| Change to netincome | -2742.00M | -7307.00M | 2886.00M | 2863.00M | -222.00M |
| Capital expenditures | 3236.00M | 2711.00M | 2791.00M | 2594.00M | 2196.00M |
| Change receivables | 261.00M | -3811.00M | -1249.00M | -742.00M | -644.00M |
| Cash flows other operating | 26895.00M | 21402.00M | 6869.00M | -7761.00M | -612.00M |
| Cash and cash equivalents changes | -1350.00M | 218.00M | 483.00M | 158.00M | -89.00M |
| Change in working capital | -4456.00M | 12804.00M | -275.00M | -4031.00M | -926.00M |
| Stock based compensation | 872.00M | 1182.00M | 756.00M | 718.00M | 949.00M |
| Other non cash items | 150.00M | -4763.00M | 3592.00M | -7025.00M | 437.00M |
| Free cash flow | 26031.00M | 29869.00M | 11612.00M | 9994.00M | 13631.00M |
Sector: Healthcare Industry: Drug Manufacturers - General
|
Stock Name
|
Change
(USD) |
Price
(USD) |
Trailing
PE (x) |
Forward
PE (x) |
Price Sales
TTM (x) |
Price to Book Value (x)
|
Enterprise Value
to Revenue (x) |
Enterprise Value
to EBITDA (x) |
|---|---|---|---|---|---|---|---|---|
| PFE Pfizer Inc |
0.01 0.03% |
29.80 | 15.52 | 9.60 | 2.31 | 1.61 | 2.56 | 9.54 |
| LLY Eli Lilly and Company |
2.77 0.22% |
1281.91 | 38.16 | 24.15 | 12.72 | 29.95 | 13.31 | 25.43 |
| JNJ Johnson & Johnson |
2.43 0.91% |
268.73 | 30.96 | 20.79 | 6.58 | 7.55 | 6.84 | 19.73 |
| ABBV AbbVie Inc |
-0.35 0.12% |
286.39 | 74.10 | 16.21 | 7.22 | 50.46 | 8.18 | 27.04 |
| RHHVF Roche Holding AG Participation |
-7.94 1.66% |
470.06 | 24.16 | 16.53 | 5.71 | 8.88 | 4.94 | 14.76 |
Pfizer Inc. discovers, develops, manufactures, markets, distributes, and sells biopharmaceutical products worldwide. It offers medicines and vaccines in various therapeutic areas, including cardiovascular metabolic, migraine, and women's health under the Eliquis, Nurtec ODT/Vydura, and the Premarin family brands; infectious diseases with unmet medical needs under the Prevnar family, Nimenrix, FSME/IMMUN-TicoVac, and Trumenba brands; and COVID-19 prevention and treatment, and potential future mRNA and antiviral products under the Comirnaty and Paxlovid brands. The company also provides medicines and vaccines in various therapeutic areas, such as biosimilars for chronic immune and inflammatory diseases under the Xeljanz, Enbrel, Inflectra, Eucrisa/Staquis, and Cibinqo brands; amyloidosis, hemophilia, endocrine diseases, and sickle cell disease under the Vyndaqel family, Oxbryta, BeneFIX, and Genotropin brands; sterile injectable and anti-infective medicines under the Sulperazon, Medrol, Zavicefta, Zithromax, Vfend, and Panzyga brands; and biologics, small molecules, immunotherapies, and biosimilars under the Ibrance, Xtandi, Inlyta, Retacrit, Lorbrena, and Braftovi brands. In addition, the company is involved in the contract manufacturing business. It serves wholesalers, retailers, hospitals, clinics, government agencies, pharmacies, individual provider offices, retail pharmacies, and integrated delivery systems, as well as disease control and prevention centers. The company has collaboration agreements with Bristol-Myers Squibb Company; Astellas Pharma US, Inc.; Myovant Sciences Ltd.; Merck KGaA; Valneva SE; BioNTech SE; and Arvinas, Inc., as well as strategic partnership with CSPC Pharmaceutical Group Limited to launch a local brand of the COVID-19 oral therapeutic treatment Nirmatrelvir/Ritonavir in China, and a collaboration with Carrick Therapeutics Limited. Pfizer Inc. was founded in 1849 and is headquartered in New York, New York.
| Name | Title | Year Born |
|---|---|---|
| Dr. Albert Bourla D.V.M., DVM, Ph.D. | Chairman & CEO | 1962 |
| Mr. Frank A. D'Amelio | CFO & Exec. VP | 1958 |
| Dr. Mikael Dolsten M.D., Ph.D. | Chief Scientific Officer and Pres of Worldwide Research, Devel. & Medical | 1958 |
| Mr. Douglas M. Lankler | Exec. VP & Gen. Counsel | 1966 |
| Mr. John D. Young | Advisor | 1965 |
| Ms. Angela Hwang | Chief Commercial Officer & Pres of Global Biopharmaceuticals Bus. | 1966 |
| Mr. David M. Denton | Chief Financial Officer & Exec. VP | 1965 |
| Ms. Jennifer B. Damico | Sr. VP, Controller & Principal Accounting Officer | 1968 |
| Ms. Lidia L. Fonseca | Exec. VP and Chief Digital & Technology Officer | 1969 |
| Mr. Christopher J. Stevo CFA | Sr. VP & Chief Investor Relations Officer | NA |
Disclaimer - (*)This information, including any data, is sourced from Unicorn Data Services SAS, trading as EOD Historical Data (“EODHD”) on an ‘as is’ basis, using their API. We cannot guarantee the completeness or validity of the information and data provided on this page, as well as via the API. In some cases, the data may include analyst ratings or recommendations sourced through the EODHD API, which are intended solely for general information purposes.
This information does not consider your personal objectives, financial situation, or needs. Kalkine is not liable for any errors or omissions in the information provided or for any actions taken in reliance on it. You should seek advice from a financial adviser, stockbroker or other professional adviser (including taxation and legal advice) as necessary before acting on this information.

Download a free report with stock ideas and industry insights for general information.
Download Free Report Now →


Basic Materials
 +1.60%
Communication Services
+0.03%

Consumer Cyclical
+0.13%

Consumer Defensive
 -0.42%

Energy
-0.04%

Financial Services
+0.20%
Financials
-0.35%

Healthcare
+1.06%

Industrials
+0.66%

Real Estate
-0.25%

Technology
+1.34%

Utilities
+0.28%
Note: Daily price change (%) by sector excluding stocks with +/-90% daily price change. Companies above $500 million market capitalization are considered.
 Portfolio
 Watchlist


 Please wait processing your request...